It also offers visualization capabilities out of the box using the various plotting and visualization packages.
In this guide, we will explore how you can display the figures created using Plotly in the Spyder IDE.
Example:
In some cases, the Spyder IDE fails to display the figures depending on the target environment.
For example, consider the following code:
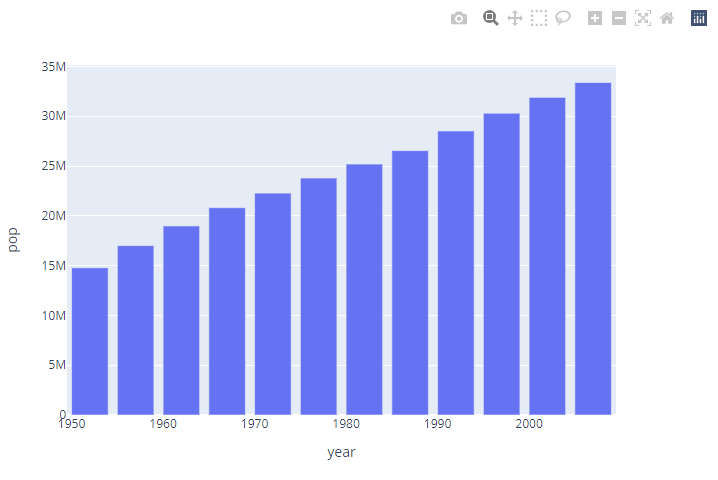
df = px.data.gapminder().query("country == 'Canada'")
fig = px.bar(df, x='year', y='pop')
fig.show()
In the previous example, we create a simple Bar Plot using Plotly in the Spyder IDE. However, when we call the fig.show() function, no figure is displayed.
Let us discuss the various methods and techniques to fix this issue.
What Causes Spyder Not to Display Plots?
The first question you may ask is, why is Spyder not displaying my Plots? Although there is no one definitive reason as to why the Spyder may fail to display the Plotly figure, one of the major cause is the renderer engine.
By default, Plotly selects the most appropriate rendering engine depending on the target environment.
In Spyder, Plotly fails to select the default renderer unless explicitly specified.
Keep in mind that this cause may vary depending on your environment, installed packages, plotting library, and more.
Fix #1: Set the Default Renderer
The most common and easiest method to fix this issue is telling Plotly the renderer that you wish to use.
In most cases, using your system’s browser is a safe bet. You can update the default renderer in Spyder by running the following code:
io.renderers.default='browser'
In the previous code, we start by importing the io module as io. We then set the default renderer using the io.renderers.default.
You can now call the fig.show() function. Plotly opens a new browser window and display the specified plot as shown in the following:
Another alternative to the browser is allowing Plotly to display the figures as static images. For example, you can set the default renderer to svg as shown in the following:
Once updated, you can run the fig.show() function and Plotly will display the figure as a static image in the Plots Tab in Spyder.

Fix #2: Using Plotly Offline Module
If you do not wish to modify the default renderer, you can use the offline module in Plotly.
An example is as follows:
import plotly.graph_objs as go
fig = go.Figure(data=[{'type': 'scatter', 'y': [1,2,3]}])
plot(fig)
Running Plotly in offline mode will force the Figure to be rendered in your default browser.
Conclusion
This article shows you how you can display the Plotly Figures in the Spyder IDE.