Creating World Map With go.Choropleth
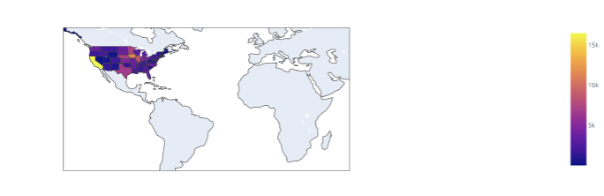
We can use the Choropleth class from graph_objects to create a Choropleth Map. To illustrate, consider the following code that uses US exports data to create a Choropleth Map:
import pandas as pd
import plotly.express as px
df = pd.read_csv('https://raw.githubusercontent.com/plotly/datasets/master/2011_us_ag_exports.csv')
fig = go.Figure(data=go.Choropleth(
locations=df['code'],
z = df['total exports'].astype(float),
locationmode = 'USA-states',
colorscale = px.colors.sequential.Plasma,
))
fig.show()
The previous code will create a world map with the data in the dataset highlighted in the following figure:
Setting Map Scope
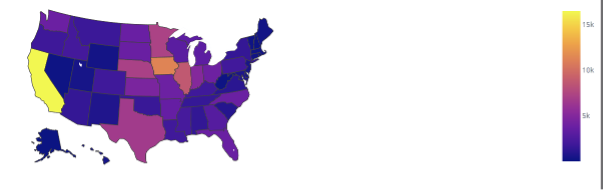
We can limit the map display scope to only the US by setting the geo_scope parameter as follows:
fig.show()
The resulting figure is shown in the following figure:
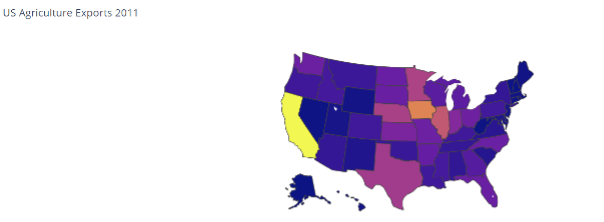
Setting Figure Title
We can also use the update_layout() function to set a title for the figure as illustrated in the following code:
fig.show()
Output
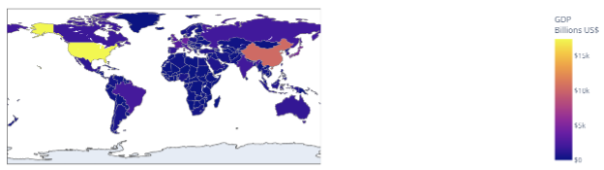
World GDP Choropleth Map
Similarly, we can use the Choropleth class to create a world map showing the World GDP as illustrated in the following code:
import pandas as pd
df = pd.read_csv('https://raw.githubusercontent.com/plotly/datasets/master/2014_world_gdp_with_codes.csv')
fig = go.Figure(data=go.Choropleth(
locations = df['CODE'],
z = df['GDP (BILLIONS)'],
text = df['COUNTRY'],
colorscale = 'Plasma',
marker_line_color='darkgray',
marker_line_width=0.5,
colorbar_tickprefix = '$',
colorbar_title = 'GDP<br>Billions US$',
))
fig.show()
Resulting World Map
Conclusion
This article covered the basics of creating Choropleth Maps using the Choropleth class from Plotly graph_objects. We learned how to create a world map, set the map scope, set the figure title, and the world GDP Choropleth Map. For more articles like this, check out Linux Hint to enhance or gain more knowledge.