Create a Bar Plot
Before we can learn how to sort a bar plot, let us create a simple bar plot for illustration purposes.
Keep in mind that we will not use a complex bar with customization and templates. You can learn more about that in our Plotly Bar Plot tutorial.
For this one, we create a simple bar plot with numerical values and labels. An example code is as shown in the following illustration:
import pandas as pd
df = pd.DataFrame({
"Language": [
"Julia",
"APL",
"COBOL",
"Assembly",
"Python",
"Solidity",
"TypeScript",
"C#",
"Kotlin",
"SQL",
"C++",
"R",
"C",
"JavaScript",
"Java",
"SAS",
"Delphi",
"HTML/CSS",
"VBA",
"Matlab",
"PHP",
"Dart",
"Clojure",
"Erlang",
"F#",
"LISP",
"Ruby",
"Elixir",
"Scala",
"Perl",
"Go",
"Rust",
"Ocaml",
"Groovy",
"Crystal",
"Objective-C",
"Bash/Shell",
"Haskell",
"Fortran",
"Lua",
"Swift",
"PowerShell",
],
"salary": [
75592,
75000,
71105,
70368,
70276,
69516,
69318,
69108,
68000,
67734,
67186,
65580,
64572,
64243,
63984,
63984,
62328,
57588,
50496,
43724,
106644,
103000,
95526,
95000,
93000,
92959,
92780,
90073,
89204,
87047,
86948,
85320,
84690,
83165,
81666,
80250,
80000,
79568,
78468,
78084,
77966,
75932
]
})
fig = px.bar(df, x="Language", y='salary', color='Language')
fig.show()
In the given code, we have a DataFrame that contains the popular programming language and the average yearly salary (Data From Stackoverflow 2022 Developer Survery).
https://survey.stackoverflow.co/2022/#section-top-paying-technologies-top-paying-technologies
NOTE: We altered the given data to suit the needs for this tutorial.
We then created a bar plot of the languages and the average salary. The resulting figure is as shown:
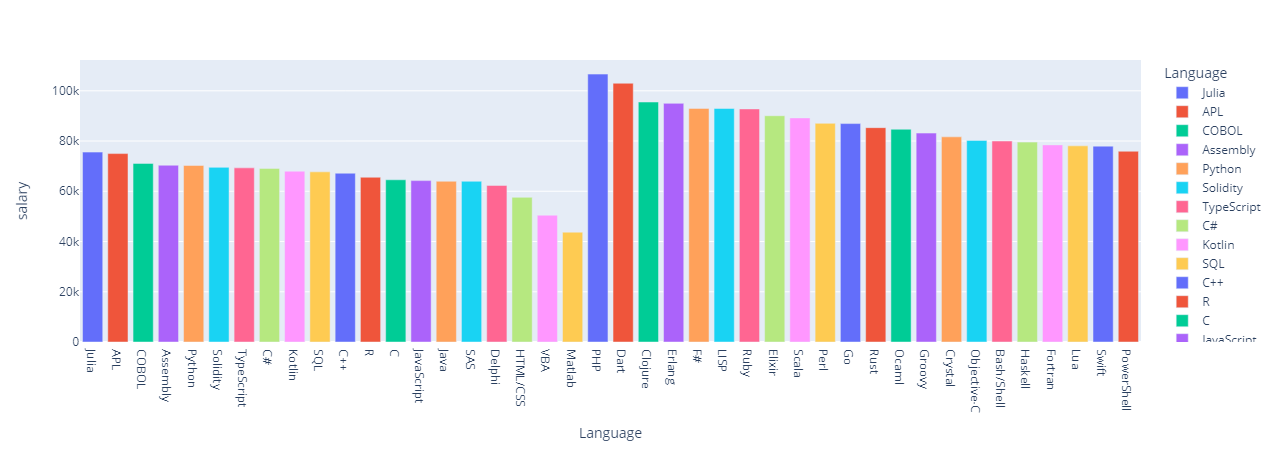
We can see from this example that the data is not sorted. Let us now learn how we can sort it.
Bar Plot with Sorted Values
In Plotly.express, we can sort a bar plot using the update_layout() function and the xaxis and yaxis parameters.
In our example, we wish to sort the data based on the salary starting with the smallest to the highest salary. Hence, we need to use the xaxis parameter. We can then set the categoryorder value as total ascending.
Consider the following example code:
fig.update_layout(barmode='stack', xaxis={'categoryorder': 'total ascending'})
fig.show()
In this case, we used the sort values based on the total salary. This should return a figure as shown:
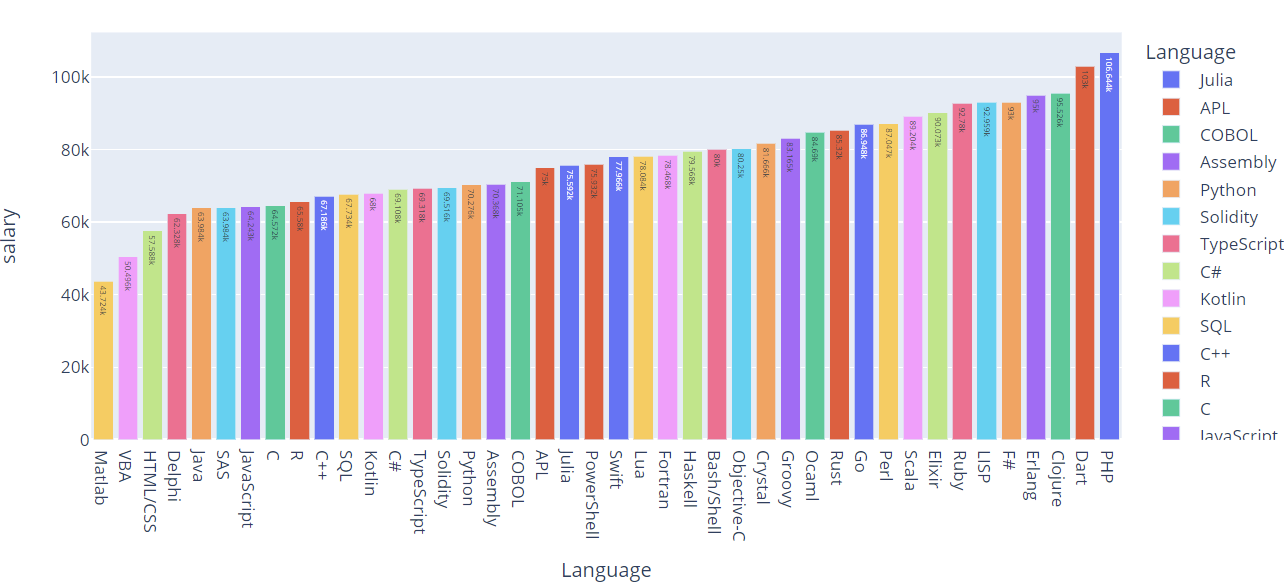
Here, we can see that the values are sorted from the smallest to the highest.
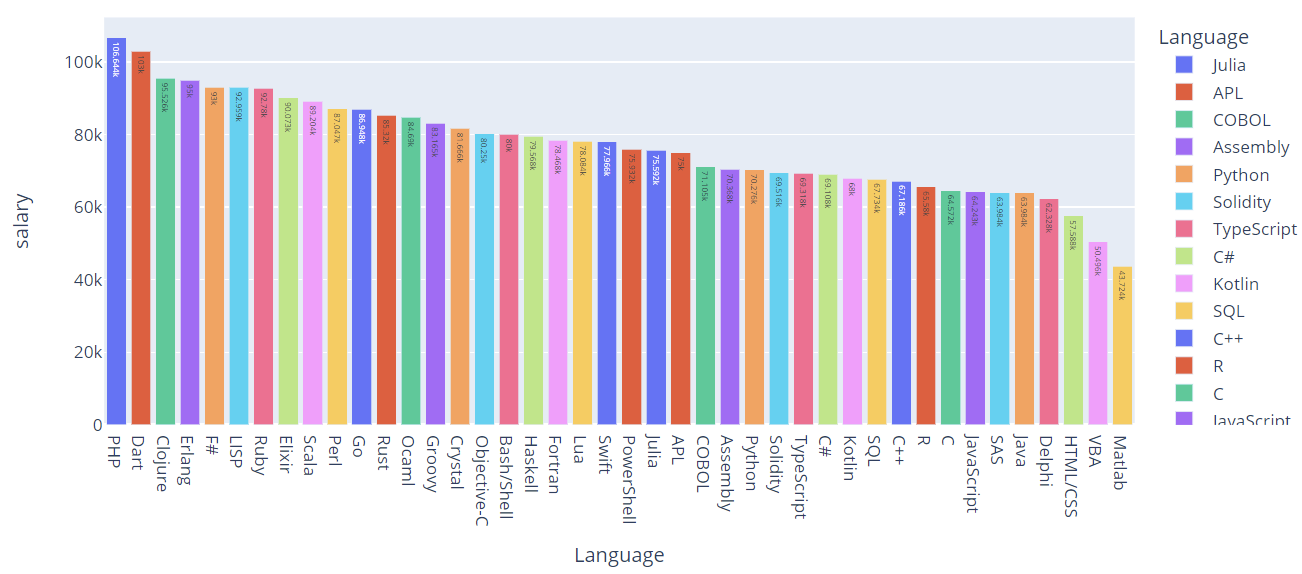
To reverse the values, we can set the sort order to ‘total descending’.
Similarly, this returns a figure as follows:
NOTE: The previous data represents the actual values. We tweaked it to match the purpose of this tutorial.
Conclusion
Using this tutorial, you learned how to sort a bar plot based on the numerical data either in ascending or descending order. Feel free to explore the document for more.
Thanks for reading. See you in the next article!!