Without much further delay, let’s dive in the discuss on how this function can help us display the Plotly figures.
Plotly.Io.Show()
The function takes a syntax as shown in the following:
The function parameters are as follows:
- Fig – Refers to the figure or object to display.
- renderer – Defines a name of a registered renderer. You can specify more than one renderer using the + operator. If no renderer is specified, the function defaults to the one defined in the plotly.renderes.default.
- validate – Determines if the figure should be validated first before display. Defaults to true.
- width – Specifies the width in pixels used for the figure.
- height – Determines the height in pixels used to plot the figure.
- config – Represents a dictionary of parameters used to configure the figure.
The function returns a None value but displays the figure using the specified renderer.
Displaying a Figure
To display a Plotly figure using various renderers, we can use the various methods as discussed in the following sections:
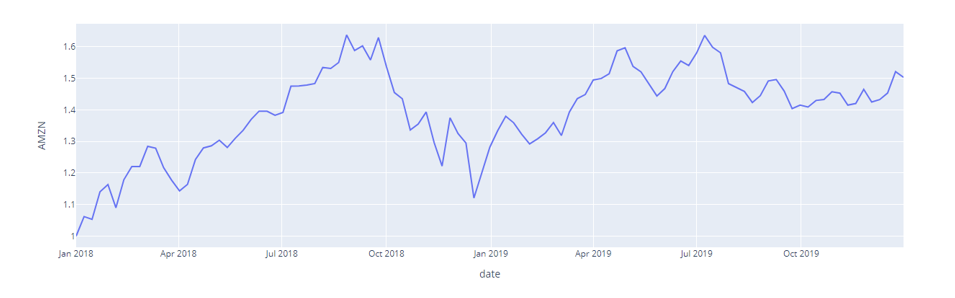
df = px.data.stocks()
fig = px.line(df,x="date", y="AMZN")
The given code starts by importing the Plotly express module. Next, we plot a simple line graph of the stocks for Amazon.
To display the figure, we can use the show function as shown in the following:
The previous function displays the figure in the working environment as shown in the following:
In most cases, we can omit the show() function and allow the figure to display itself as follows:
Although the renderer framework is flexible, calling the fig without the show() function will only work if the last expression evaluates to a figure. The plotly.py file must be running from an IPython Kernel.
If you are looking to pass the parameters such as width and height, you can pass the figure to the io.show() function as shown in the following:
io.show(fig=fig, width=1200, height=800)
In this case, we use the io.show() function with the specific parameters such as width and height.
The resulting figure is as follows:
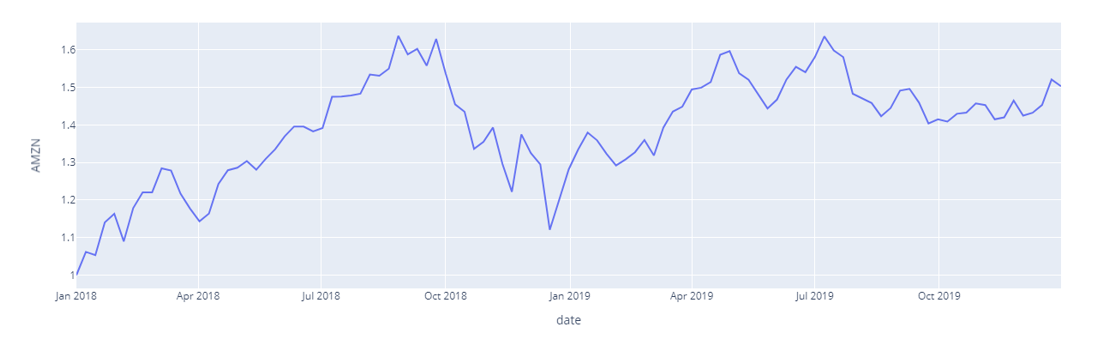
NOTE: The previous image is not to scale and does not represent the accurate image dimensions.
Specifying the Default Renderer
The default set renderer is responsible for handling the display of the plotted figures in Plotly. However, we can customize the renderer by editing the plotly.io.renderers object.
Keep in mind that the renderer is automatically chosen in popular environments such as Jupyter Notebooks, Jupyter Lab, Visual Studio Code Notebooks, Google Collab, Kaggle, and IPython shell.
To show the default renderers, run the following command:
io.renderers
The previous code returns the default and available renderers as shown in the following:
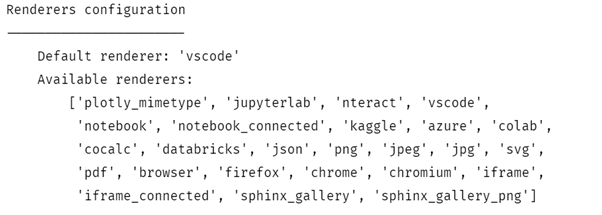
Keep in mind that the default renderer depends on the environment in which you are running the code.
To set the default renderer, we can run the following code:
io.renderers.default = "browser"
The previous code replaces the default renderer with the browser.
Although customizing the renderer can be helpful in custom environments, sticking with the default can be beneficial. Plotly chooses the best one for that scenario.
Conclusion
Using this article, you learned the various ways of configuring how Plotly displays the various figures. The plotly.io.show() function is a great tool when you need to customize the Plotly renderers.
Thanks for reading!