Let’s dive in.
Plotly.io.read_json
The read_json() function from Plotly’s io module allows you to pass a JSON string from a file or readable object. It then parses the JSON data and returns the figure from it.
The function syntax is as shown:
The function parameters are below:
- File – specifies the path to the local file or a readable Python object as a string.
- Output _type – specifies the figure type or type name. Accepted values include “graph_objects.Figure. Figure, graph_objects.FigureWidgets, or FigureWidget’
- Skip_invalid – allows the function to ignore invalid properties and attempt to construct the Figure despite the errors (TRUE). If set to False, the function will return an error on any invalid property.
- Engine – specifies the JSON decoding engine. Accepted values include:
- ‘json’ – uses the built-in JSON module.
- ‘orjson’ – uses the orjson module (requires install).
- ‘auto’ – automatically choose.
The function will then return the original Figure of type Figure or FigureWidget as specified in the output_type parameter.
Plotly Export Figure to JSON
Before we learn how to create a figure from a JSON string, let’s cover how we can export a figure into a JSON file.
For that, we can use the plotly.io.to_json() function. An example code is shown below:
df = px.data.tips()
fig = px.box(df, y="total_bill")
fig.show()
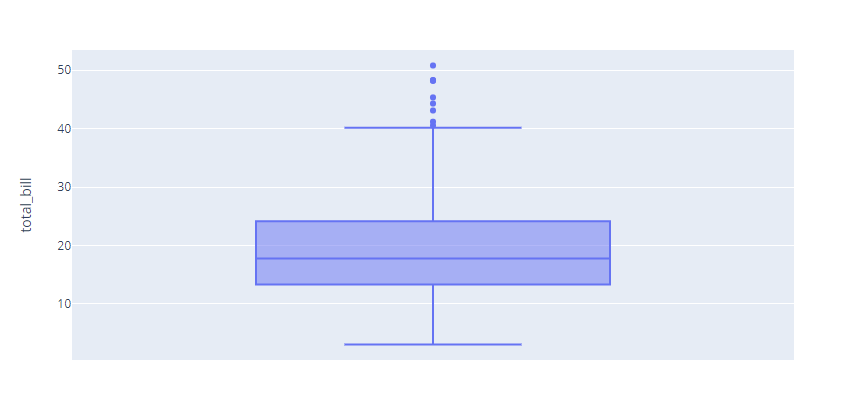
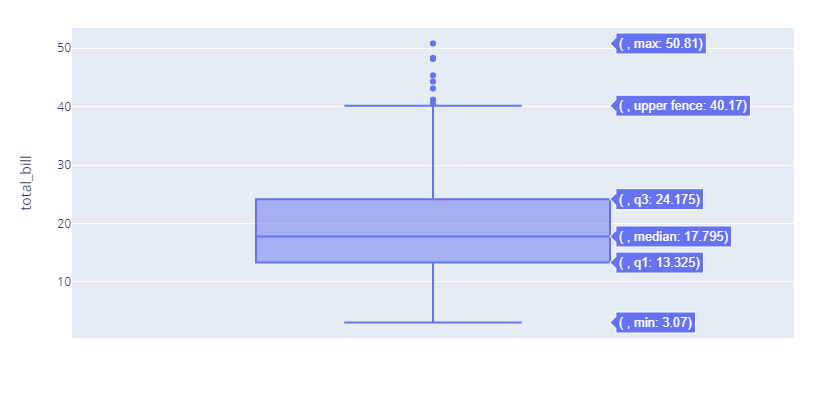
The code above creates a simple box plot, as shown in the resulting figure below:
We can export it as a JSON file as shown:
with open('box_plot.json', 'w') as f:
f.write(io.to_json(fig))
The code above will take the figure and convert it to a JSON string. We then write the JSON string to a file using the open function.
The example resulting JSON string is as shown below:
"data": [
{
"alignmentgroup": "True",
"hovertemplate": "total_bill=%{y}",
"legendgroup": "",
"marker": {
"color": "#636efa"
},
"name": "",
"notched": false,
"offsetgroup": "",
"orientation": "v",
"showlegend": false,
"x0": " ",
"xaxis": "x",
"y": [
16.99,
10.34,
21.01,
23.68,
24.59,
25.29,
8.77,
26.88,
15.04,
14.78,
10.27,
35.26,
15.42,
----data truncated-----------------
Once we have the JSON file, we can proceed to convert it into a figure.
Plotly Convert JSON to Figure
To convert the JSON file into a Figure, we can use the read_json() function as shown below:
fig = io.from_json(data, output_type='FigureWidget')
fig.show()
The code above should read the specified JSON file and construct the figure as a FigureWidget.
Unlike the from_json() function, the read_json function does not require you to parse the JSON into a string first.
Closing
This tutorial covered how to construct a Figure from a JSON file or Python Object using the plotly.io.read_json() function.


