In this tutorial, we will learn how to convert Plotly figures or graph_objects into JSON strings.
Let’s get started.
Plotly.io.to_json()
The plotly.io.to_json() function allows us to convert a figure into a JSON string. The function syntax is as shown below:
The parameters are as shown:
- Fig – specifies the figure or object to convert into a JSON string.
- Validate – a Boolean value that determines if a figure should be validated before converting to JSON.
- Pretty – if true, the JSON string is pretty-printed otherwise, the JSON string is returned in a compact format.
- Remove_uids – if true, it allows plotly to remove the trace UIDs from the JSON representation.
- Engine – specifies the JSON encoding engine. Accepted values include:
- ‘json’ – uses the Python’s built-in JSON module.
- ‘orjson’ – specifies the orjson engine. Much faster but requires installation.
- ‘auto’ – automatically select the engine depending on the available package.
The function will then return the input figure as a JSON representation as a string type.
Convert Plotly Express Figure to JSON
We can convert a figure into a JSON string using the to_string function as shown in the example below:
import plotly.io as io
df = px.data.stocks()
fig = px.line(df, x='date', y='FB')
io.to_json(fig)
In the example above, we use the stock data from Plotly express and plot a simple line graph.
We then use the to_json() string to convert the figure into a JSON string.
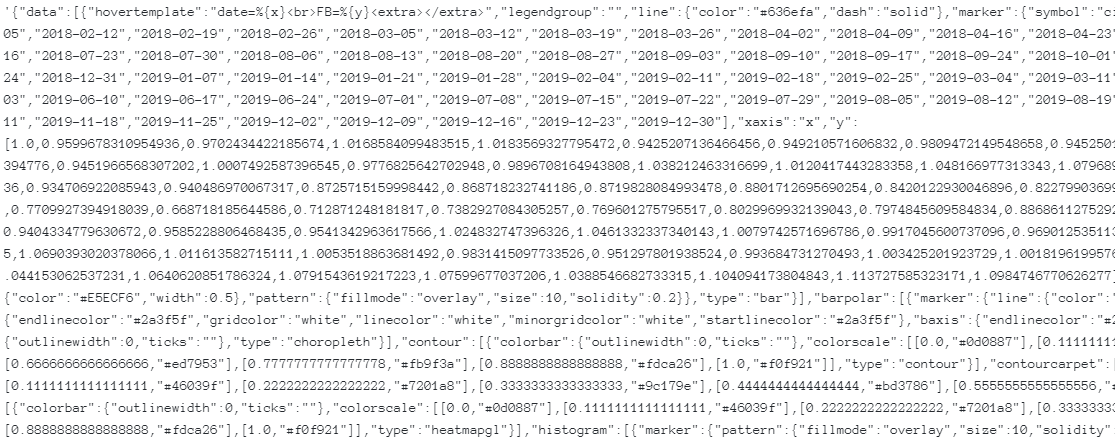
The code above should return:
To create more readable data, we can use the pretty parameter as shown:
To change the engine:
The above code requires the orjson package to be installed on your system. You can do so by running pip as:
To remove UIDs, set the parameter to True as shown:
Closing
This short article shows how to convert a figure into JSON string using the to_json() function.

