It is therefore no surprise that you may need to convert a specific Plotly figure into a HTML string.
In this tutorial, we will learn how to use the Plotly io module to convert a figure into an HTML string representation.
Let’s dive in.
Plotly.io.to_html() function
The to_html() function from Plotly’s io module allows you to pass a specific figure as a parameter and convert it into an HTML string.
The function syntax is expressed as shown below:
Let us explore the function parameters, below:
- Fig – refers to the figure object or the dictionary representation of the figure.
- Config – specifies the plotly.js configuration options. Pass the configuration options as a dictionary.
- Auto_play – determines if the animation sequence should play automatically on the page load. This parameter is useful if you have a figure containing animated frames.
- Include_plotlyjs – this parameter specifies how the plotly.js library is included in the HTML. Accepted values in this parameter include:
- True – includes the plotly.js library as a script tag in the HTML document. This will increase the file size but will allow the file to be used in offline environments.
- ‘cdn’ – setting the include_plotlyjs parameter to ‘cdn’ will add a script tag pointing to a remote link for the plotly.js library. Use this option when in a networked environment or file size-sensitive environment.
- ‘directory’ – includes a script tag that points to an external plotly.min.js bundle located in the same directory as the HTML document.
- ‘require’ – setting the value to require will load the plotly.js library using require.js. Ensure that require.js is installed and available globally on the system.
- ‘False’ – does not include the plotly.js library. Avoid this value when setting the full_html parameter to True as it will render the entire document, unusable.
- include_mathjax – specifies if the file should include the mathjax.js library. Accepted values are similar to include_plotlyjs except the ‘require’ value.
- Post_script – allows you to include JavaScript snippets that are executed after the plot creation.
- Full_html – if true, the function will return a string containing the entire HTML document, starting with the <html> tags. If false, the function will return an HTML string starting with the <div> element.
- Animation_opts – allows you to specify custom animation properties as a dictionary. These values are then passed to the plotly.animate function in plotly.js.
- Default_width – specifies the default width of the resulting figure in pixels.
- Default_height – specifies the default height of the figure in pixels.
- Validate – determines if the figure should be validated before being converted to an HTML string.
- Div_id – specifies a value of the id attribute of the div tag where the plot is located.
Then, the function returns a string representation of the figure as a string.
Example Usage
The following code shows how to use the to_html function to convert a figure into an HTML string representation.
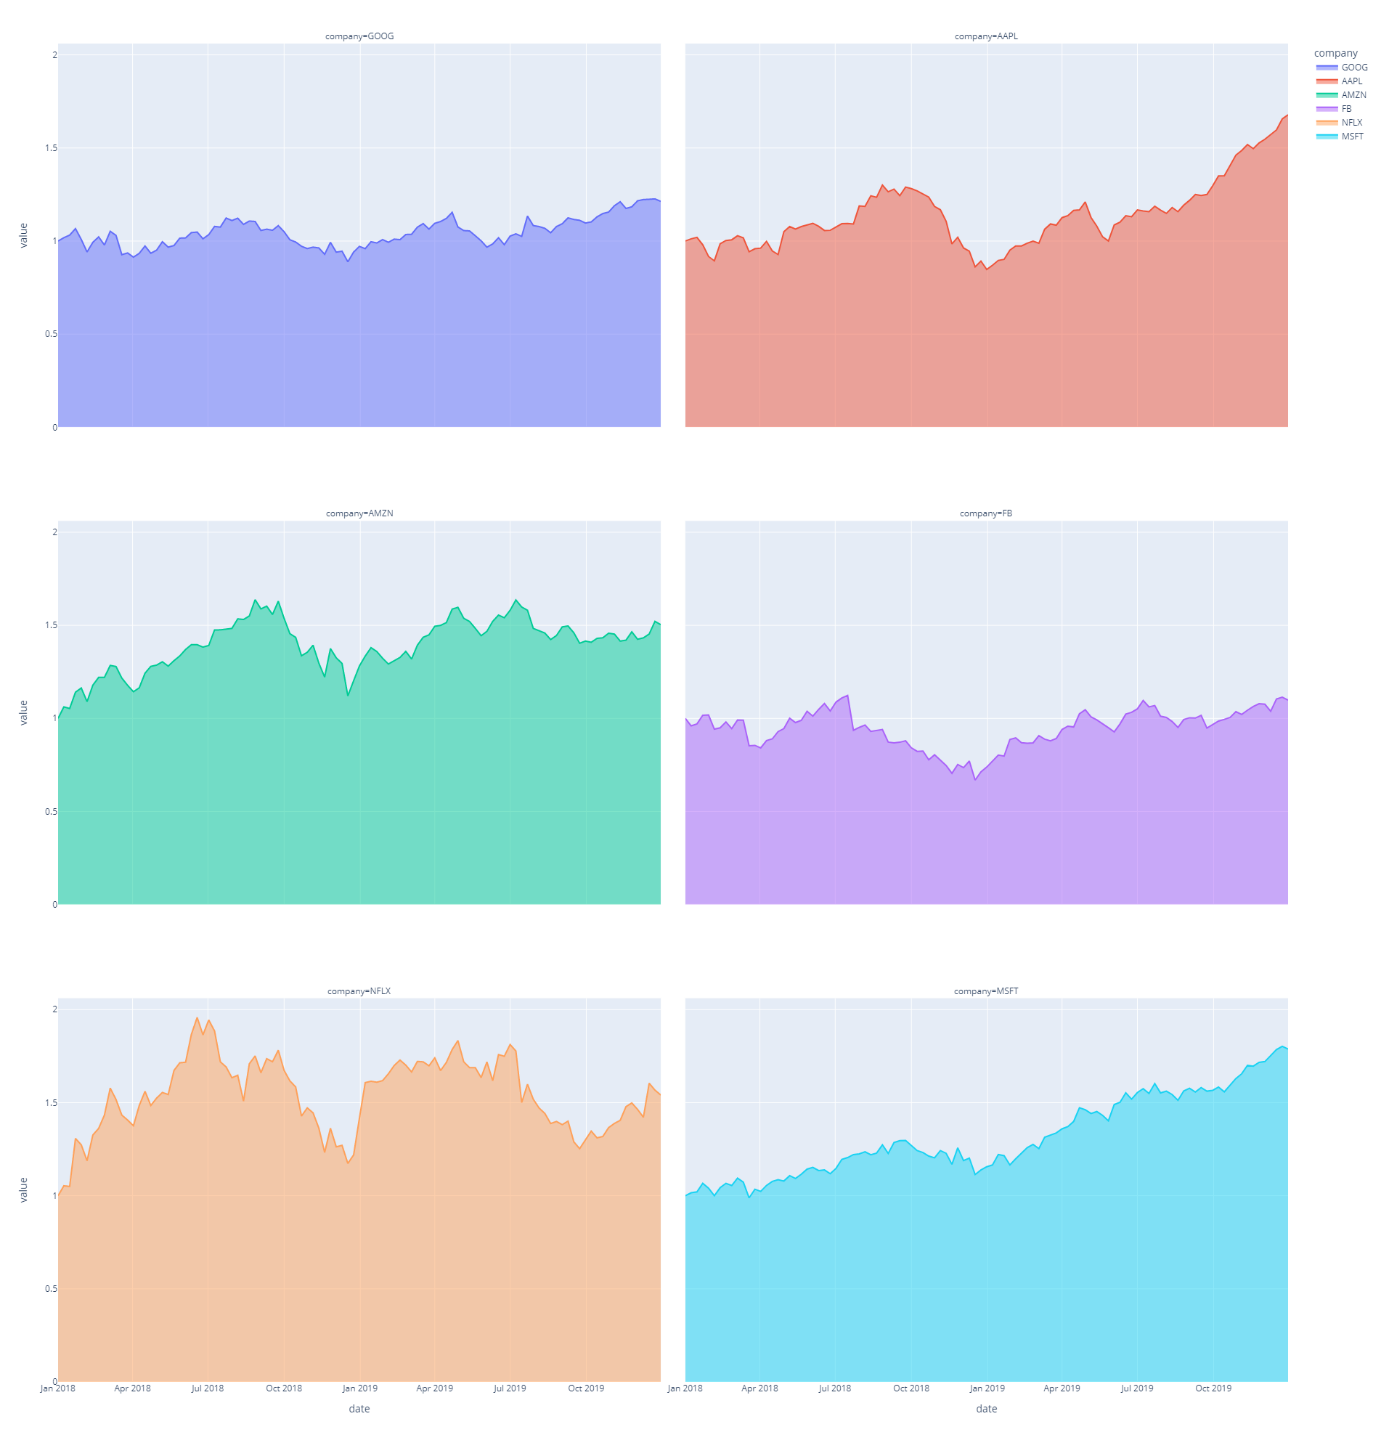
df = px.data.stocks(indexed=True)
fig = px.area(df, facet_col='company', facet_col_wrap=2)
fig.show()
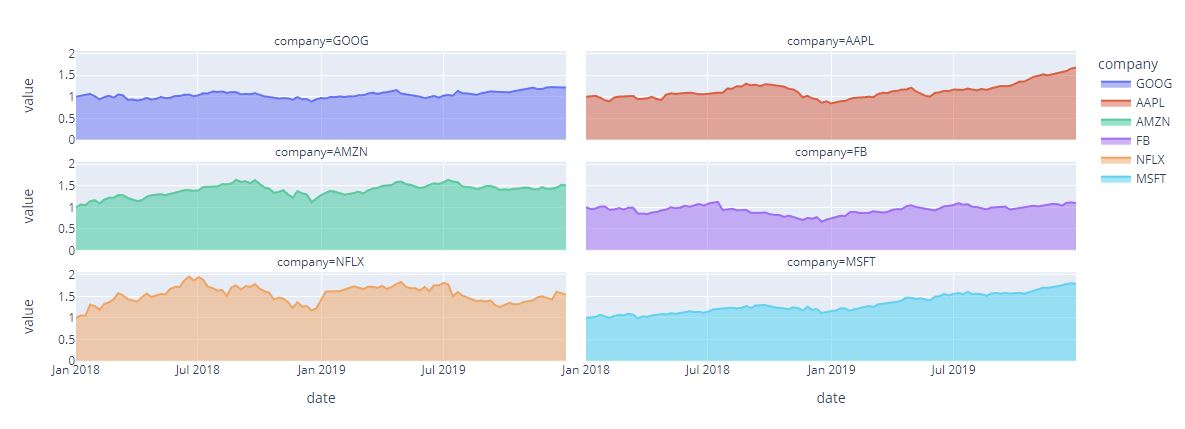
In the example above, we start by importing the Plotly express module as px. We then create a data frame using the stock data from Plotly.
Finally, we create a facetted area plot using the px.area function. This should return a figure as shown below:
We can convert the above figure into an HTML string representation as shown in the code below:
io.to_html(fig, full_html=False)
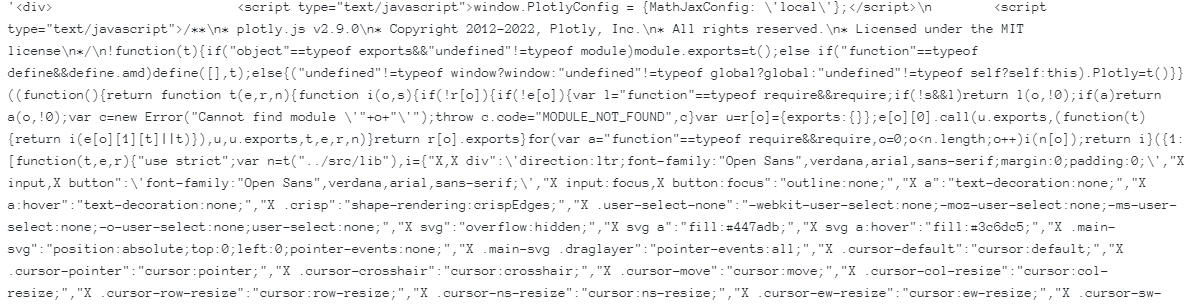
Running the code above should return a massive HTML string as shown in the screenshot below:
Note that the HTML document starts at the <div> element. If you want to include the entire HTML file, set the parameter full_html=True as shown:
io.to_html(fig, full_html=True)
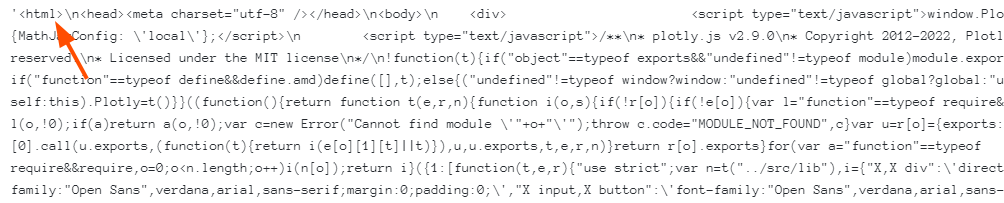
Notice the markup starts at the <html> tag.
To include plotly.js, we can set the parameter as:
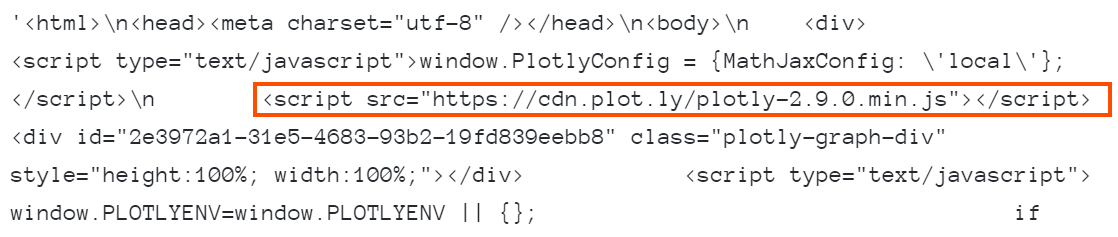
io.to_html(fig, include_plotlyjs='cdn', full_html=True)
In the example above, we tell the function to include the plotly.js library via a CDN link.
We can verify this from the output below:
The best way to use the to_html document is by exporting the HTML string into an HTML file.
We can do this by running a simple code as shown below:
with open('facetted.html', 'w') as f:
f.writelines(io.to_html(fig, include_plotlyjs='cnd', full_html=True))
In this example, we use the file module in Python to write the HTML string as aN html file.
We can then open the HTML document in the browser and view the figure as shown:
Conclusion
Congratulations, you have successfully exported your Plotly figure as an HTML string using the plotly.io.to_html function.