Hence, it is common that you will need to convert JSON data into a different format using various parsers.
For this tutorial, we will discuss how you can take a JSON string and construct a Plotly figure from it.
Let’s get started.
How to Export a Figure into JSON String
Before we dive into how we can convert a JSON string into a figure, we need to learn how to do the reverse first.
You can check our tutorial on the plotly.io.write_json() function to learn more. However, to recap, the write_json() function allows us to pass a figure and save it as a JSON string.
An example is as shown below:
import pandas as pd
df = pd.DataFrame(dict(
x = [1,2,3,4,5],
y = [1,2,3,4,5]
))
fig = px.line(df, x="x", y="y")
import plotly.io as io
io.write_json(fig, 'line_plot.json, pretty=True, engine='orjson')
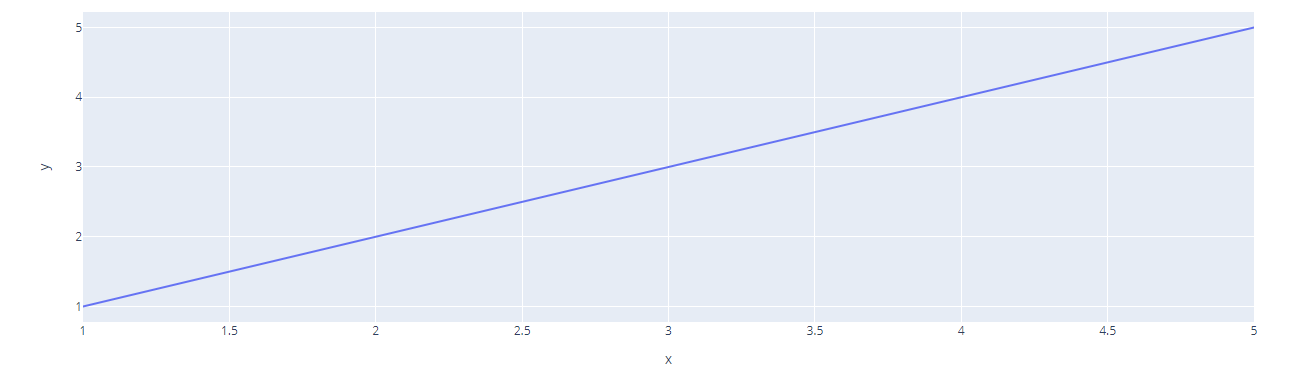
In the example above, we are using Plotly to create a simple line graph using the px.line() function.
We then convert the figure into a JSON string and save it to a file called line_plot.json using the write_json() format.
The code above should return a JSON string as shown below:
"data": [
{
"hovertemplate": "x=%{x}<br>y=%{y}",
"legendgroup": "",
"line": {
"color": "#636efa",
"dash": "solid"
},
"marker": {
"symbol": "circle"
},
"mode": "lines",
"name": "",
"orientation": "v",
"showlegend": false,
"x": [
1,
2,
3,
4,
5
],
"xaxis": "x",
"y": [
1,
2,
3,
4,
5
],
"yaxis": "y",
"type": "scatter"
}
],
"layout": {
"template": {
"data": {
"bar": [
{
"error_x": {
"color": "#2a3f5f"
},
"error_y": {
"color": "#2a3f5f"
},
"marker": {
"line": {
"color": "#E5ECF6",
"width": 0.5
},
"pattern": {
"fillmode": "overlay",
"size": 10,
"solidity": 0.2
}
},
"type": "bar"
}
],
…………………………value truncated……………………………………………………..
As we can see from the output above, we get a well formatted JSON string, which we can use to convert back into a Plotly figure.
Plotly.io.from_json()
This is where the from_json() function comes into play. It allows us to construct a figure from a JSON string.
The function syntax is as shown below:
The function parameters are as shown:
- Value – specifies the string or bytes object that contains the JSON string.
- Output_type – This parameter specifies the output figure type or type name. Accepted values include:
- Graph_objects.Figure
- ‘Figure’
- Graph_objects.FigureWidget
- ‘FigureWidget’
- Skip_invalid – tells the function if it should ignore invalid properties from the JSON string. If false, any invalid property will raise an exception.
- Engine – specifies the JSON parsing engine.
The function will then return a Figure or FigureWidget as specified by the output_type parameter.
Example 1
To illustrate how this function works, let us take our previous JSON string and convert it back into a figure.
The code is as shown:
import plotly.io as io
with open('line_plot.json') as f:
data = json.load(f)
data = json.dumps(data)
io.from_json(data, output_type='Figure')
In the example above, we start by importing the json and plotly.io modules.
We then use the open function to read the JSON file we exported earlier. This should give us a JSON string in a dictionary format.
Since the from_json() function can only accept the JSON data as a string and not a dictionary, we convert it into a JSON string using the json.dumps() function.
Finally, we pass the JSON string to the function and return a figure as shown:
If you want to plot the figure as a widget, we can change the output_type parameter to ‘FigureWidget’ as shown in the code below:
with open('line_plot.json') as f:
data = json.load(f)
data = json.dumps(data)
io.from_json(data, output_type='FigureWidget')
The code should return a similar figure but as a Widget as shown by the type:
The resulting output:
We can see that the resulting value is a figurewidget.FigureWidget type.
Conclusion
In this article, we discovered how we can create a figure from a JSON string using Plotly’s from_json() function.
Check out other Linuxhint tutorials on Plotly to expand your knowledge.