It is therefore no surprise that we can create Tables using Plotly and the graph_objects module as we will show in this article.
Plotly.graph_objects.Table
We can use the Table function from the graph_objects class to create a table in Plotly. The function syntax is as follows:
The following are some important parameters that you can use to create a Table object:
- arg – Defines a dictionary containing a list of properties compatible with the constructor or an instance of the Table class.
- cells – Defines the cells instance.
- columnorder – Sets the rendered order of the columns.
- columnwidth – Sets the width of the columns as a ratio.
Example 1:
The following example shows how we can create a simple table using the Table method from the graph_objects class.
fig = go.Figure(
data=[go.Table(
header=dict(values=['Column_A', 'Column_B']),
cells=dict(values=[['row_A1', 'row_A2', 'row_A3'], ['row_B1', 'row_B2', 'row_B3']]))])
fig.show()
This returns a Table Figure as shown in the following:
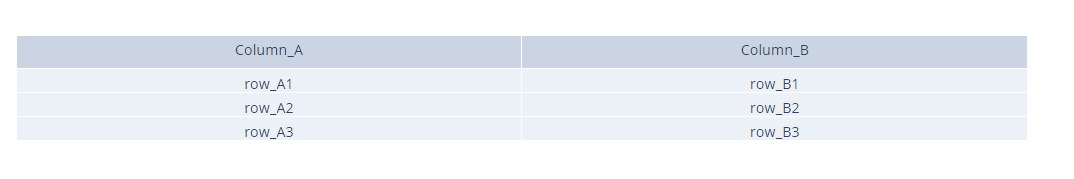
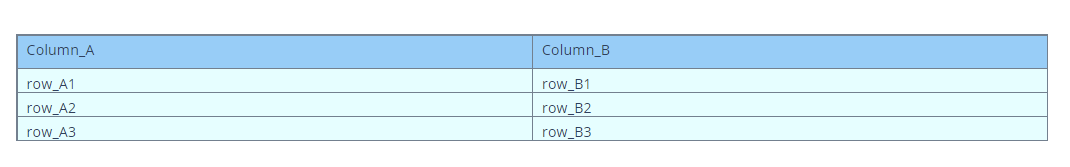
Table Styling
We can also style the table by setting the various parameters as shown in the following:
fig = go.Figure(
data=[go.Table(
header=dict(values=['Column_A', 'Column_B'],
line_color='slategray',
fill_color='lightskyblue',
align='left'),
cells=dict(values=[['row_A1', 'row_A2', 'row_A3'], ['row_B1', 'row_B2', 'row_B3']],
line_color='slategray',
fill_color='lightcyan',
align='left'))])
fig.show()
The resulting table is as follows:
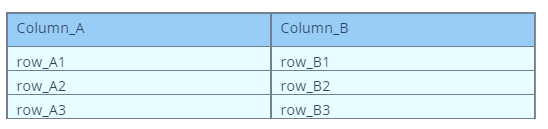
Setting the Table Width and Height
We can also set the width and height of the table as:
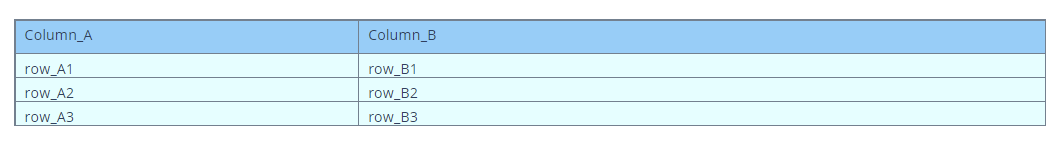
Setting the Row and Column Size
You can also change the size of the rows and columns as a ratio. Take the following code:
fig = go.Figure(
data=[go.Table(
columnwidth=[1,2],
header=dict(values=['Column_A', 'Column_B'],
line_color='slategray',
fill_color='lightskyblue',
align='left'),
cells=dict(values=[['row_A1', 'row_A2', 'row_A3'], ['row_B1', 'row_B2', 'row_B3']],
line_color='slategray',
fill_color='lightcyan',
align='left'))])
fig.show()
The given code creates a table with column ratio of 1 to 2.
Output:
Conclusion
This article explores the basics of working with tables in Plotly using the graph_objects module. Feel free to explore the other documents for more.
Happy coding!!