In this article, we will explore how to create 3-dimensional mesh diagrams using the graph_objects module.”
Let’s dive in.
Simple Mesh Diagram
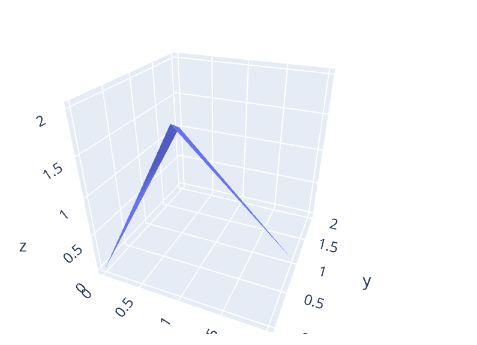
We can create a simple 3d mesh plot by specifying the x, y, and z values to the mesh3d class.
Take the code snippet provided below:
x = [0,1,2,0]
y = [0,0,1,2]
z = [0,2,0,1]
fig = go.Figure(data=go.Mesh3d(
x=x, y=y, z=z
))
fig.show()
The code above will create a simple tetrahedron, as shown in the output below:
To create a complete tetrahedron plot, you can specify the i, j, and k parameters.
Mesh Diagram From Dataset
Similarly, you can create a mesh diagram from a dataset by specifying the x, y, and x parameters as columns within the DataFrame.
An example is as shown:
import pandas as pd
df = pd.read_csv('https://raw.githubusercontent.com/plotly/datasets/master/ply/sphere-ply.csv')
fig = go.Figure(data=go.Mesh3d(
x=df['x'],
y=df['y'],
z=df['z'],
i=df['i'],
j=df['j'],
k=df['k']
))
fig.show()
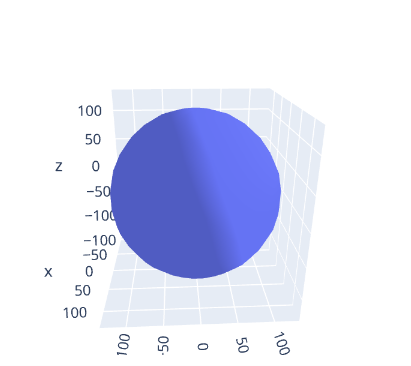
The code above will load the sphere dataset into the df variable. We then plot the sphere by specifying the x, y, z, i, j, and k parameters as the columns in the DataFram.
The resulting figure is as shown:
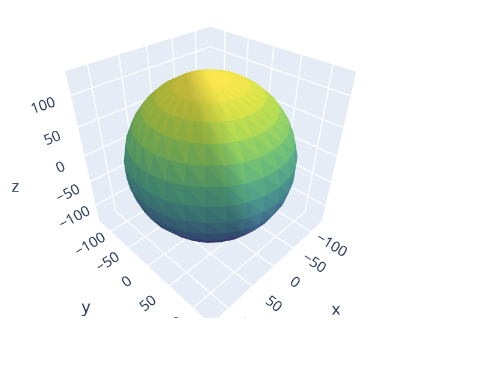
We can also set a different color using the facecolor parameter as shown:
x=df['x'],
y=df['y'],
z=df['z'],
i=df['i'],
j=df['j'],
k=df['k'],
facecolor=df['facecolor']
))
Termination
In this tutorial, we explored how to create 3d mesh diagrams using Mesh3d class from the Plotly graph_objects module.


