In this short article, we will explore how to display image data using Plotly graph_objects and Image class.
Syntax and Parameter List
The class syntax is as shown:
plotly.graph_objects.Image(arg=None, colormodel=None, customdata=None, customdatasrc=None, dx=None, dy=None, hoverinfo=None, hoverinfosrc=None, hoverlabel=None, hovertemplate=None, hovertemplatesrc=None, hovertext=None, hovertextsrc=None, ids=None, idssrc=None, legendgrouptitle=None, legendrank=None, meta=None, metasrc=None, name=None, opacity=None, source=None, stream=None, text=None, textsrc=None, uid=None, uirevision=None, visible=None, x0=None, xaxis=None, y0=None, yaxis=None, z=None, zmax=None, zmin=None, zsmooth=None, zsrc=None, **kwargs)
You can explore the documentation for detailed explanation of the parameters. However, the following are some important parameters you will use:
- arg – specifies a dictionary of properties compatible with the constructor.
- colormodel – defines the color model used to map numerical colors to components specified in the z parameter.
- dx – sets the pixel’s horizontal scale.
- dy – sets the pixel’s vertical scale.
- visible – determines if the trace is visible or not.
- x0 – determines the image’s x position.
- y0 – sets the image’s y position.
- z – A 2-dimensional array in which each element is an array of 3 or 4 numbers representing a color.
Displaying Multichannel Image with Plotly graph_objects
We can use the Image class to display multichannel image as shown in the sample code below:
import plotly.graph_objects as go
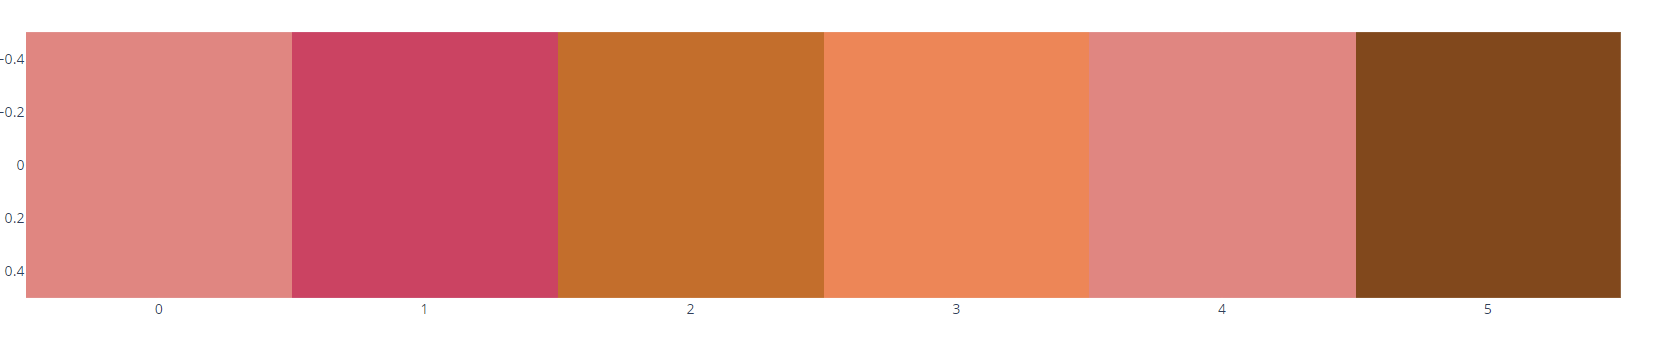
rgb_values = [[[240,128,128], [222, 49, 99], [210,105,30],
[255,127,80], [240, 128, 128], [139,69,19]]]
fig = go.Figure(data=go.Image(z=rgb_values))
fig.show()
rgb_values = [[[240,128,128], [222, 49, 99], [210,105,30],
[255,127,80], [240, 128, 128], [139,69,19]]]
fig = go.Figure(data=go.Image(z=rgb_values))
fig.show()
The code above should display an image with the color’s specified in the arrays.
An example output is as shown:
Displaying Binary Image
You can also display a binary image by passing it as a binary string to the Image class.
An example illustration is as shown:
import plotly.graph_objects as go
from skimage importdata
import base64
from io import BytesIO
from PIL import Image
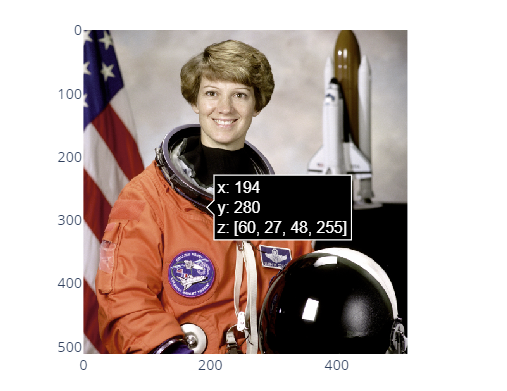
img = data.astronaut()
img_obj = Image.fromarray(img)
prefix = "data:image/png;base64,"
with BytesIO() as stream:
img_obj.save(stream, format='png')
b64_str = prefix + base64.b64encode(stream.getvalue()).decode('unicode_escape')
fig = go.Figure(data=go.Image(
source=b64_str
))
fig.show()
from skimage importdata
import base64
from io import BytesIO
from PIL import Image
img = data.astronaut()
img_obj = Image.fromarray(img)
prefix = "data:image/png;base64,"
with BytesIO() as stream:
img_obj.save(stream, format='png')
b64_str = prefix + base64.b64encode(stream.getvalue()).decode('unicode_escape')
fig = go.Figure(data=go.Image(
source=b64_str
))
fig.show()
The resulting image is:
Conclusion
In this article, we explored the basics of using the Image class in Plotly graph_objects to display image data.