Let us discuss how we can create a cone plot using the Plotly graph_objects module.”
Syntax
The syntax for creating a cone plot using the Plotly graph_objects module is as shown below:
cmax=None, cmid=None, cmin=None, coloraxis=None, colorbar=None, colorscale=None,
customdata=None, customdatasrc=None, hoverinfo=None, hoverinfosrc=None,
hoverlabel=None, hovertemplate=None, hovertemplatesrc=None, hovertext=None,
hovertextsrc=None, ids=None, idssrc=None, legendgroup=None, legendgrouptitle=None,
legendrank=None, lighting=None, lightposition=None, meta=None, metasrc=None,
name=None, opacity=None, reversescale=None, scene=None, showlegend=None,
showscale=None, sizemode=None, sizeref=None, stream=None, text=None, textsrc=None,
u=None, uhoverformat=None, uid=None, uirevision=None, usrc=None, v=None,
vhoverformat=None, visible=None, vsrc=None, w=None, whoverformat=None,
wsrc=None, x=None, xhoverformat=None, xsrc=None, y=None, yhoverformat=None,
ysrc=None, z=None, zhoverformat=None, zsrc=None, **kwargs)
The following is the list of the most important parameters you will need to know:
- u – defines the x component of the vector.
- v – specifies the y component of the vector.
- w – sets the z component of the vector.
- x – sets the x coordinate of the vector.
- y – sets the y coordinate of the vector.
- z – sets the z coordinate of the vector.
Example
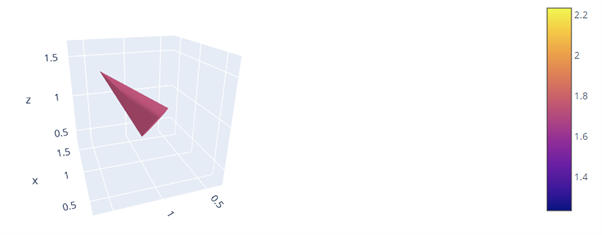
The following example shows how to create a simple cone plot using the plotly graph_objects.
fig = go.Figure(data=go.Cone(
x=[1],
y=[1],
z=[1],
u=[1],
v=[1],
w=[1]
))
fig.show()
The code above should return a cone plot as shown. Keep in mind you will need to rotate and customize the camera to get the specific view.
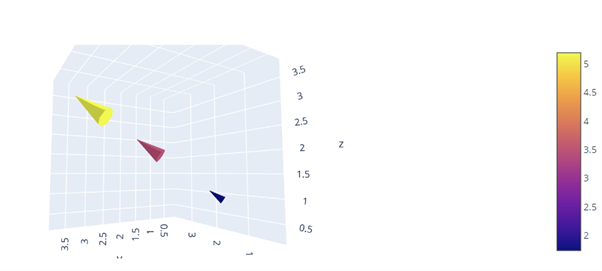
Multiple Cones
To create multiple cones, you can specify multiple values in the x,y,z,u,v, and w parameters as shown:
fig = go.Figure(data=go.Cone(
x=[1,2,3],
y=[1,2,3],
z=[1,2,3],
u=[1,2,3],
v=[1,2,3],
w=[1,2,3]
))
fig.show()
This should return multiple cones with the specified parameters as shown:
Closing
This article illustrates how you can create 3d cones using the plotly graph_objects module.