Check out our tutorial on Plotly OHLC plots to learn more.
Simple Candlestick Chart Using graph_objects
Let us illustrate how we can create a simple candlestick chart. For this example, we will use the EUR/USD data from Yahoo Finance.
Check the resource below to learn more.
https://finance.yahoo.com/quote/EURUSD%3DX/history?p=EURUSD%3DX
The code is provided below:
import pandas as pd
df = pd.read_csv('EURUSD.csv')
fig = go.Figure(
data=go.Candlestick(
x=df['Date'],
open=df['Open'],
high=df['High'],
low=df['Low'],
close=df['Close']
)
)
fig.show()
In the example above, we use the pandas package to load the downloaded CSV into a DataFrame.
We then use the graph_objects.Figure and graph_objects.Candlestick() function to create a candlestick plot of the data.
The resulting plot is as shown:
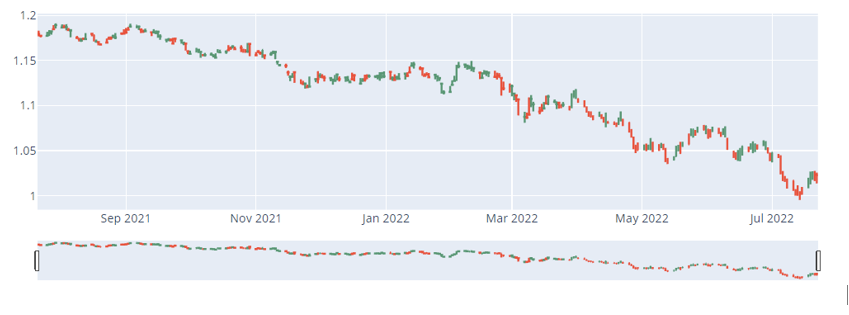
You can use the RangeSlider provided at the bottom of the plot to navigate over a specific date range.
Candlestick Disable RangeSlider
To disable the range slider for the candlestick, you can use the update_layout() function as shown:
import pandas as pd
df = pd.read_csv('EURUSD.csv')
fig = go.Figure(
data=go.Candlestick(
x=df['Date'],
open=df['Open'],
high=df['High'],
low=df['Low'],
close=df['Close']
)
)
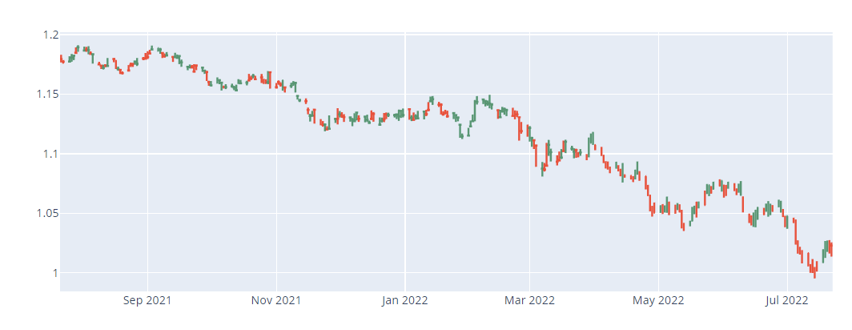
fig.update_layout(xaxis_rangeslider_visible=False)
The code above should return the candlestick plot without the rangeslider included.
Setting Custom Candlestick Colors
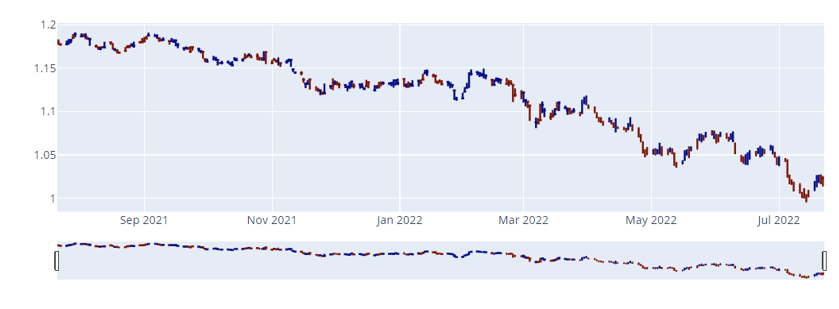
You can also set custom candlestick colors for both rise and drop lines using the increasing_line_color and decreasing_line_color parameters, respectively.
Example:
import pandas as pd
df = pd.read_csv('EURUSD.csv')
fig = go.Figure(
data=go.Candlestick(
x=df['Date'],
open=df['Open'],
high=df['High'],
low=df['Low'],
close=df['Close'],
increasing_line_color='darkblue',
decreasing_line_color='darkred'
)
)
fig.show()
The code above will return a candlestick figure with custom colors as shown:
Conclusion
This article shows you how you can create candlestick charts using the Plotly graph_objects module.
Happy coding!!