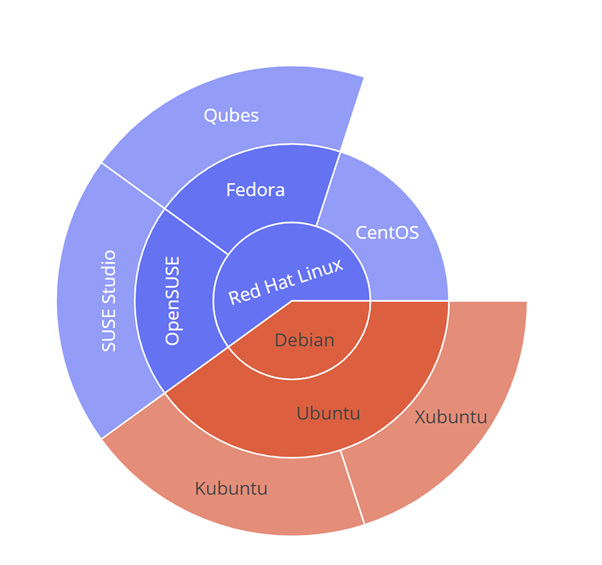
The data starts at the center, and all the children span the outside rings of the plot.
In this article, we will explore how we can create sunburst plots using the Plotly Express module.”
Function Syntax and Parameter List
The function syntax is expressed below:
path=None, ids=None, color=None, color_continuous_scale=None, range_color=None,
color_continuous_midpoint=None, color_discrete_sequence=None,
color_discrete_map=None, hover_name=None, hover_data=None, custom_data=None,
labels=None, title=None, template=None, width=None, height=None,
branchvalues=None, maxdepth=None)
The most useful parameters when using this function are as shown below:
- data_frame – defines the data frame containing the column used in the plot.
- names – specifies the values used as labels for the sectors.
- values – defines the values used to set the values associated with the sectors.
- parents – defines the values used as parents in the sunburst.
- path – specifies the values used to define the hierarchy of sectors from the root level.
- ids – sets the values used to set the ids of the sectors.
Example
The code below illustrates how to create a simple sunburst plot.
data = dict(
distros=['Debian', 'CentOS', 'Fedora', 'Red Hat Linux', 'OpenSUSE', 'Qubes', 'SUSE Studio', 'Ubuntu', 'Kubuntu', 'Xubuntu'],
parents=['', 'Red Hat Linux', 'Red Hat Linux', '', 'Red Hat Linux', 'Fedora', 'OpenSUSE', 'Debian', 'Ubuntu', 'Ubuntu']
)
fig = px.sunburst(data, names='distros', parents='parents')
fig.show()
The figure above should return a sunburst figure as shown:
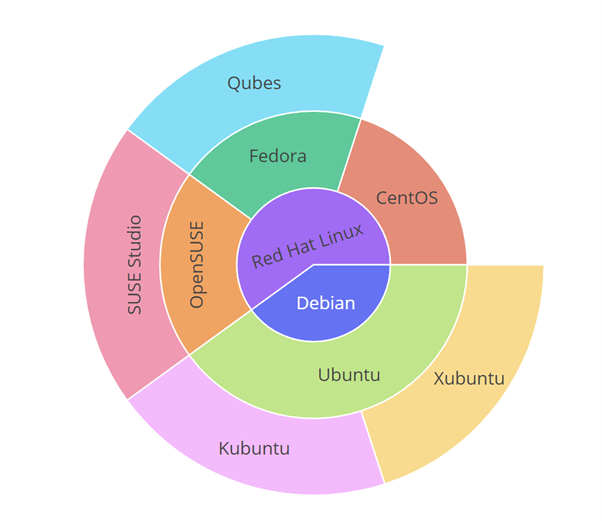
We can create a distinct color for each sector by setting the color parameter as shown:
data = dict(
distros=['Debian', 'CentOS', 'Fedora', 'Red Hat Linux', 'OpenSUSE', 'Qubes', 'SUSE Studio', 'Ubuntu', 'Kubuntu', 'Xubuntu'],
parents=['', 'Red Hat Linux', 'Red Hat Linux', '', 'Red Hat Linux', 'Fedora', 'OpenSUSE', 'Debian', 'Ubuntu', 'Ubuntu']
)
fig = px.sunburst(data, names='distros', parents='parents', color='distros')
fig.show()
The code above should assign a unique color based on the distribution as shown:
Closing
This article covers the basics of creating sunburst plots using the plotly express module.
Happy coding!!


