Plotly.express.scatter_polar()
We use the scatter_polar() function to create scatter polar plots. The function syntax is expressed as below:
The following are the most common parameters you will need to interact.
- Data_frame – specifies the data frame, dict, or array_like used as column names.
- R – specifies the values used to position the marks along the radial axis in polar coordinates.
- Theta – sets the values used to position the marks along the angular axis along the polar coordinates.
- Color – specifies the values used to assign color to the marks.
- Symbol – specifies the values used to assign symbols to the marks.
- Size – sets the values used to assign the size of the marks.
The function will return a scatter polar plot of type graph_objects.Figure.
Example
The example code below depicts how we can create a simple scatter polar plot.
df = px.data.gapminder().query("continent=='Oceania'")
fig = px.scatter_polar(df, r='year', theta='gdpPercap')
fig.show()
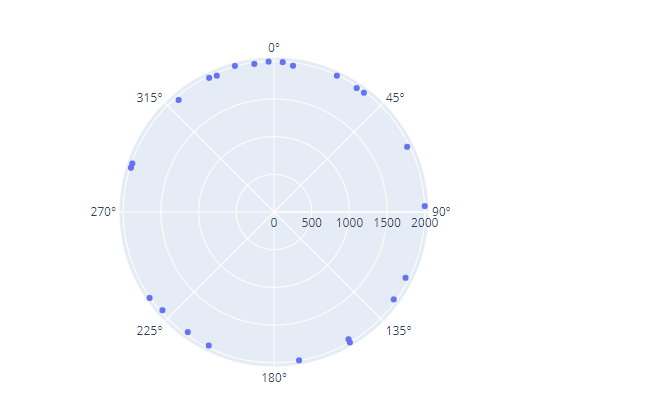
The example above uses the gapminder() data to create a scatter polar of the GDP Per Capita of the countries in the Oceania continent.
The above code should return the figure as shown:
Example 2
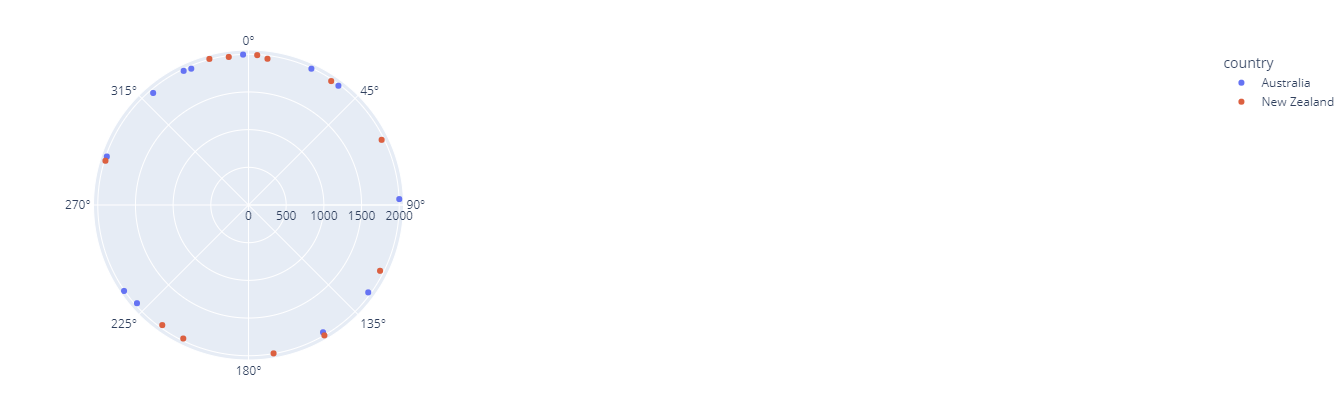
We can assign each mark a different color based on the country by setting the color parameter to the “country” column within the data frame.
Example:
df = px.data.gapminder().query("continent=='Oceania'")
fig = px.scatter_polar(df, r='year', theta='gdpPercap', color='country')
fig.show()
The code above results in a figure as shown:
We can also set different symbols using the symbols parameter:
df = px.data.gapminder().query("continent=='Oceania'")
fig = px.scatter_polar(df, r='year', theta='gdpPercap', color='country', symbol='country')
fig.show()
The resulting plot:
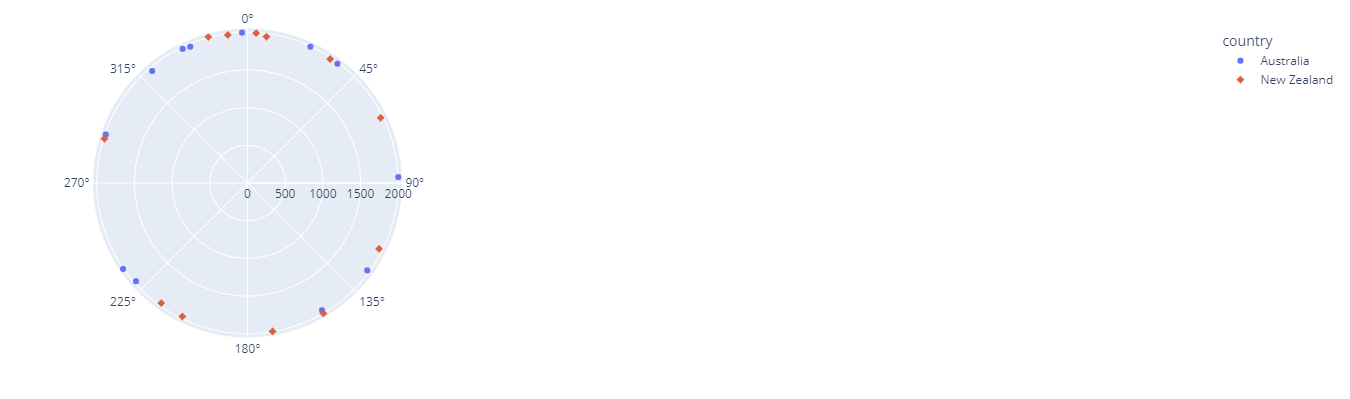
We can see that each country is assigned a different symbol and color as specified by the color and symbol parameters.
Example 3
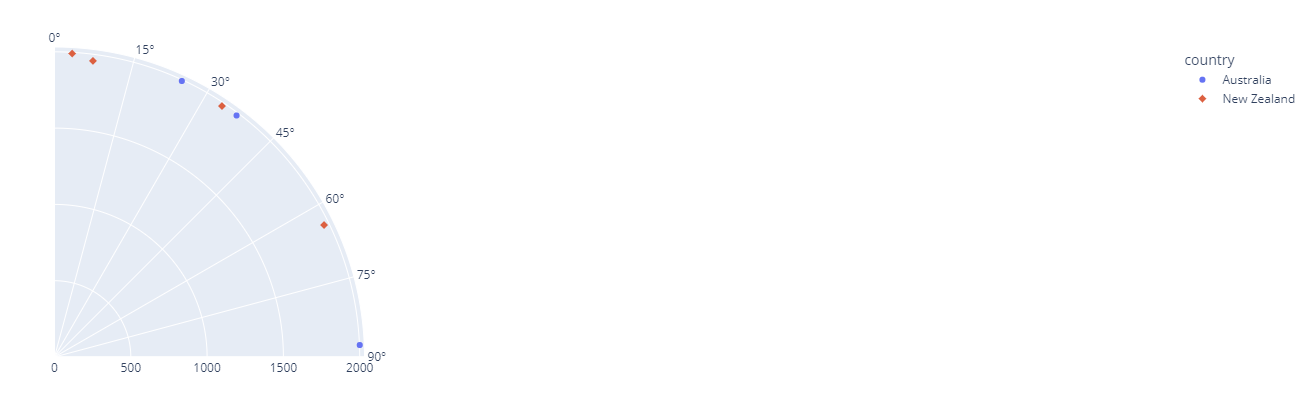
You can also plot a section of the circle by specifying the start and end degrees (as a list) using the range_theta parameter.
For example, to plot the first 90 degrees of the circle, we can run:
df = px.data.gapminder().query("continent=='Oceania'")
fig = px.scatter_polar(df, r='year', theta='gdpPercap', color='country', symbol='country', range_theta=[0,90])
fig.show()
This should return:
Conclusion
This tutorial provides you with the basics of creating scatter polar plots using the Plotly express module.