Let’s discuss.
Function Syntax and Parameters
The function takes on the following syntax:
The function parameters are as follows:
- data_frame – Specifies the data frame containing the data to be plotted on the map.
- lat – Sets the values used to position the marks according to the latitude on the map.
- lon – Similar to lat but the values of this parameter are used to position the marks along the longitude on the map.
- color – Specifies the values used to assign a unique color to the marks of the scatter.
- text – Sets the values used as text labels.
- title – Defines the title for the figure.
- width/height – Specifies the width and height of the figure in pixels.
Example:
The following code shows how to create a simple scatter mapbox. This may require you to have a Mapbox account and access token.
import pandas as pd
px.set_mapbox_access_token(open('mapbox.mapbox_token').read())
df = pd.read_csv("worldcities.csv")
lat = df.lat
lon = df.lng
city_name = df.city
fig = px.scatter_mapbox(df, lat=lat, lon=lon, labels=city_name)
fig.show()
In the given code, we start by importing the Plotly express module as px. We also import the Pandas which allows us to read the CSV data.
The next step is to read the access token for the Mapbox API. You will get this token once you signup for the mapbox.
Save the access to a file that ends in .mapbox_token and read it using the open function.
Next, we load the CSV file containing the data. You can access this file in the following resource:
https://simplemaps.com/data/world-cities
The next step is setting the latitude, longitude, and city name from the DataFrame. Finally, we create the scatter mapbox of the world cities. The resulting figure is as shown in the following:
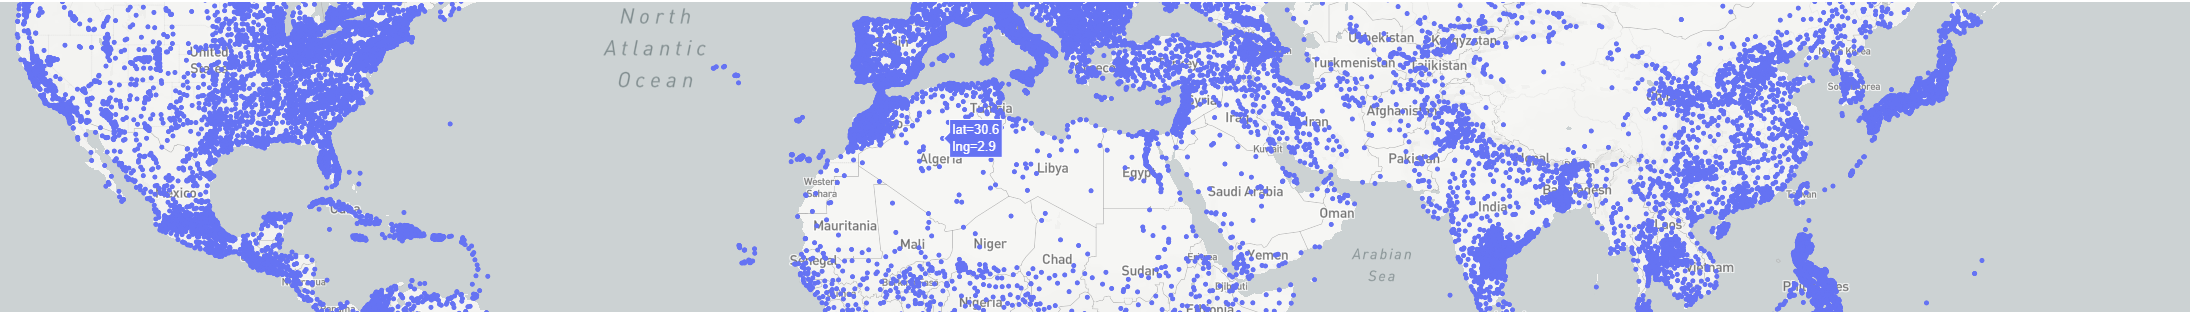
To get a better view at default, we can use the zoom parameter as shown in the following:
The given code sets the zoom level to 1, allowing you to view the entire map. This view may vary depending on your environment and screen ratio.
To set a different color for each city, set the color parameter:
Note: This process may take a long time to process depending on the DataFrame size.
Conclusion
This article describes a simple method of creating a scatter mapbox using the mapbox API and Plotly scatter_mapbox() function. Check the document for more.