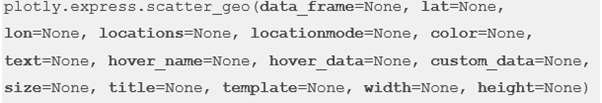
Function Syntax and Parameter
The plotly.express.scatter_geo() function provides a relatively simple syntax as shown in the following:
Keep in mind that the function also borrows other common syntax from the Plotly library. Feel free to check the docs for more.
The function parameters are the following:
- data_frame – This specifies the DataFrame containing the column names.
- lat – The lat parameter contains the values used to position the marks on the latitude of the map.
- lon – Similar to the lat parameter, the values of the lon parameter are used to position the marks along the longitude on the map.
- locationmode – Determines the set of locations used to match the entries in locations to regions on the map.
- color – Specifies the values used to assign a unique color to the scatter marks.
- title – Defines the title for the Figure.
- width/height – Sets the width and height of the figure in pixels.
Example:
The following code shows how to create a scatter map using the scatter_geo() function:
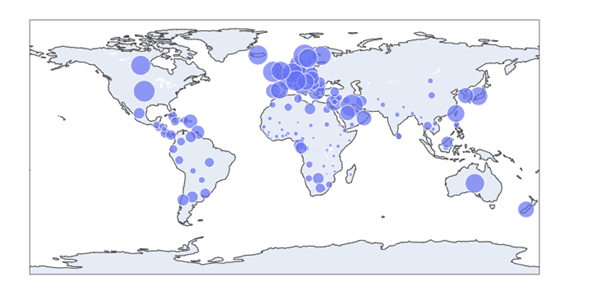
df = px.data.gapminder().query("year == 2007")
fig = px.scatter_geo(df, locations='iso_alpha', size='gdpPercap')
fig.show()
The given code returns a scatter plot of the gdpPercap of the countries in the DataFrame.
The resulting figure is as follows:
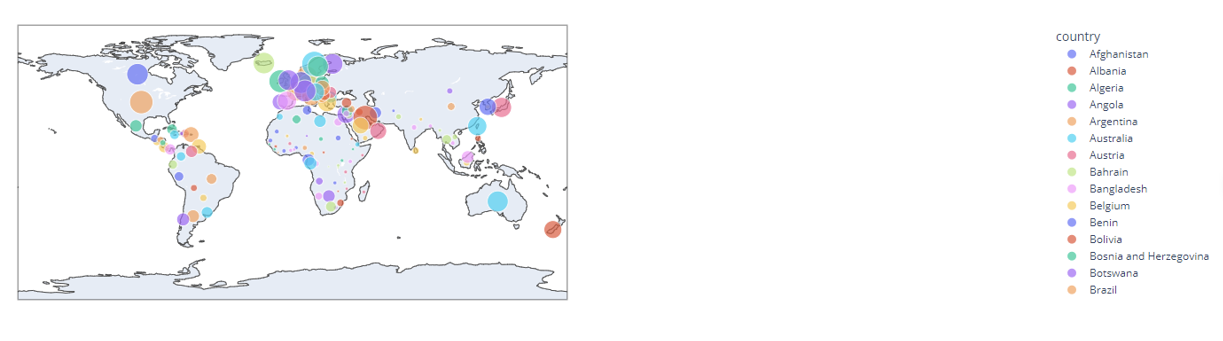
We can customize the marks of the scatter by coloring them by the country.
df = px.data.gapminder().query("year == 2007")
fig = px.scatter_geo(df, locations='iso_alpha', size='gdpPercap', color='country')
fig.show()
Output:
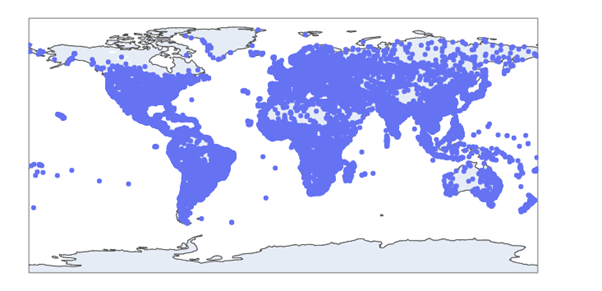
We can also create a scatter map using the MapBox API as shown in the following:
import pandas as pd
df = pd.read_csv('worldcities.csv')
px.set_mapbox_access_token(open('mapbox.mapbox_token').read())
lat=df.lat
lon=df.lng
df.head()
fig = px.scatter_geo(df, lat=lat, lon=lon)
fig.show()
This returns a world map of all the cities.
Conclusion
This article describes the simple steps of creating a scatter geo map using the scatter_geo() function.