“Parallel categories, parallel sets, or alluvial diagrams refer to a plot used to visualize multidimensional categorical data. Each node in the dataset is represented as a set of rectangular columns, with each rectangle representing a discrete value. The rectangle’s height represents the frequency of the occurrence of that value.
They are less common compared to other types of plots but can provide unique benefits in some situations.
They are less common compared to other types of plots but can provide unique benefits in some situations.
Let us discuss how we can create parallel categories plot using Plotly Express.”
Function Syntax
The following shows the function syntax and parameter list:
plotly.express.parallel_categories(data_frame=None, dimensions=None, color=None,
labels=None, color_continuous_scale=None, range_color=None,
color_continuous_midpoint=None, title=None, template=None, width=None,
height=None, dimensions_max_cardinality=50)
labels=None, color_continuous_scale=None, range_color=None,
color_continuous_midpoint=None, title=None, template=None, width=None,
height=None, dimensions_max_cardinality=50)
The function parameters are described below:
- data_frame – specifies the data frame containing the column list used in the plot.
- dimensions – sets the values used for multidimensional visualization.
- color – specifies the values used to assign colors to the marks.
- color_continous_scale – sets the lists used to build a continuous color scaled.
- title – defines the title for the figure.
- width/height – defines the figure width and height in pixels.
Practical Examples
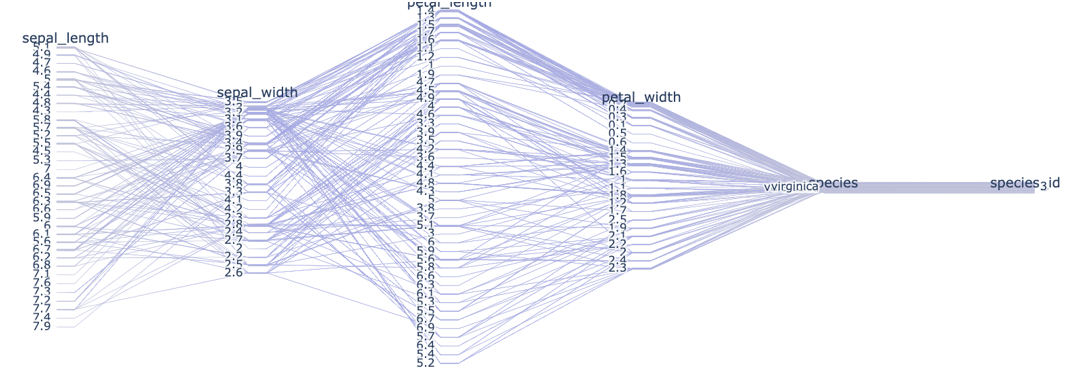
The following code shows how to create a basic parallel category diagram using the iris data.
import plotly.express as px
df = px.data.iris()
fig = px.parallel_categories(df)
fig.show()
df = px.data.iris()
fig = px.parallel_categories(df)
fig.show()
The code above should return a figure as shown below:
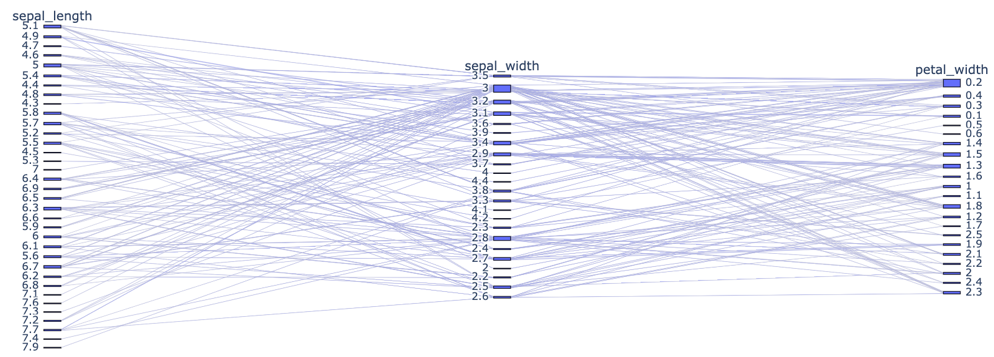
To plot specific columns, we can use the dimensions parameter:
import plotly.express as px
df = px.data.iris()
fig = px.parallel_categories(df, dimensions=['sepal_length', 'sepal_width', 'petal_width'])
fig.show()
df = px.data.iris()
fig = px.parallel_categories(df, dimensions=['sepal_length', 'sepal_width', 'petal_width'])
fig.show()
Output:
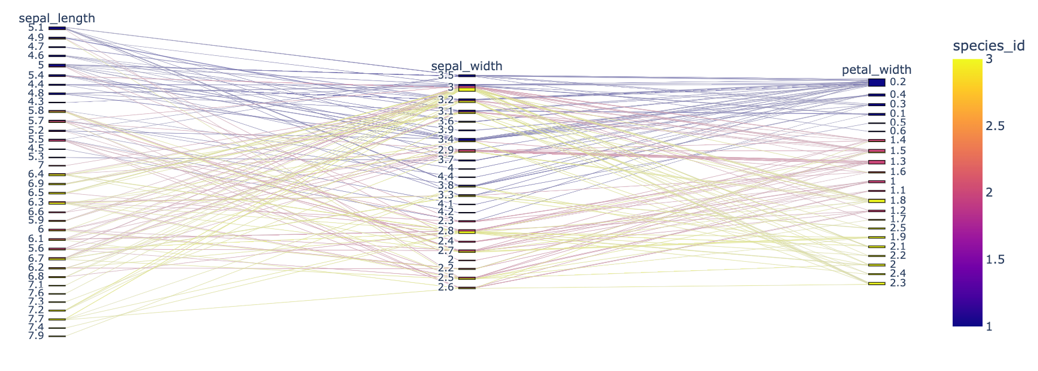
We can color the lines by setting the color parameter:
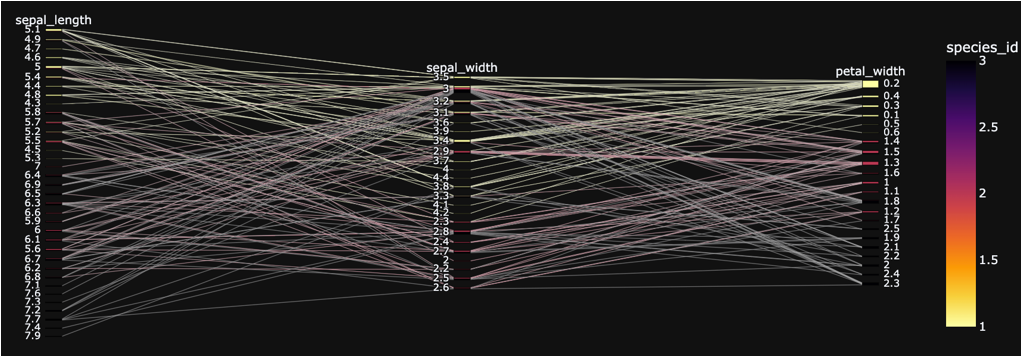
You can also specify a different color scheme by setting the color_continous_scale parameter as:
import plotly.express as px
df = px.data.iris()
fig = px.parallel_categories(df, dimensions=['sepal_length', 'sepal_width', 'petal_width'], color='species_id', color_continuous_scale=px.colors.sequential.Inferno_r, template='plotly_dark')
fig.show()
df = px.data.iris()
fig = px.parallel_categories(df, dimensions=['sepal_length', 'sepal_width', 'petal_width'], color='species_id', color_continuous_scale=px.colors.sequential.Inferno_r, template='plotly_dark')
fig.show()
Output:
Conclusion
This article explores the methods of creating a parallel category plot using Plotly’s Express module.