We will start by discussing the function syntax, the required parameters, and the return value. We will then illustrate how to use the function to display images.
Let’s dive in.
Plotly.express.imshow()
When you need to display images in your plots, use the plotly.express.imshow() function. This can be useful when you need accompanying information with the code you are working on.
However, you can use the function to display other plots such as heatmaps in a Plotly environment.
The function syntax is as shown:
Although the function may present a rather complex syntax, you will rarely need to use all the specified parameters.
The following are some of the important parameters with which you’ll need to interact.
- Img – Specifies the image data, such as an image file or an array of values. Supported array shapes include:
- (M,N) – image data as a scalar value
- (M,N,3) – image data as RGB value
- (M,N,4) – image data as RGBA values.
- Binary_format – specifies the compression format used to generate the base64 string. Supported values include:
- ‘png’ – lossless compression
- ‘jpg’ – lossy compression
- Binary_compression_level – specifies the PNG compression level passed to the backend when transforming the array to a PNG string. A higher value means a smaller size of the PNG string but more time.
- Width/height – specifies the figure width and height values in pixels.
The above are some of the useful parameters you will need to interact with. Keep in mind that different use cases may require you to make use of the other supported parameters.
However, the function will return a figure displaying the image as graph_objects.Figur type.
Example: Display an RGB Image with px.imshow()
Now that we have explored the function syntax, let us see how we can use it to perform something practical.
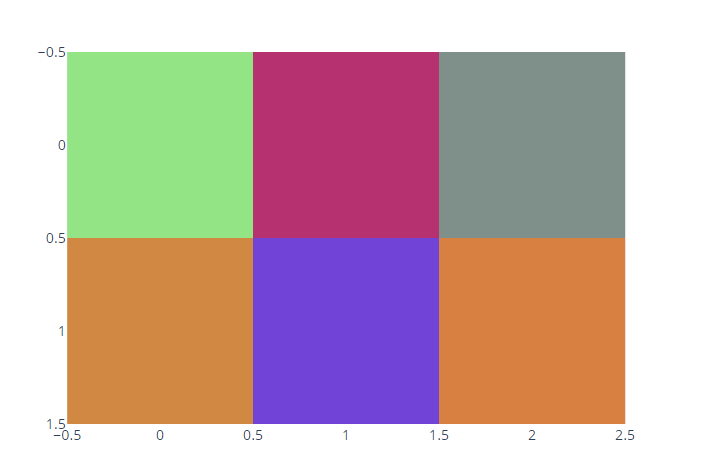
The first example we will look at is displaying an RGB image. We can do this by running the code as shown:
import numpy as np
img_data = np.array([[[111,232,122], [200, 23, 114], [122,145,138]],
[[222,133,54], [123,54,221], [232, 122, 56]]], dtype=np.uint8)
fig = px.imshow(img_data)
fig.show()
In the code above, we start by importing the Plotly express and numpy modules. Next, we provide the image data as an array of RGB values, specifying the data type as np.unit8.
Finally, we call the imshow() function to plot the image from the provided array. The resulting figure is as shown:
Example 2: Show Image from File
The most common use case of the imshow() function is displaying an image from a file. The example below shows how to do so using the imshow() function.
from skimage import io
img = io.imread('https://upload.wikimedia.org/wikipedia/commons/a/af/Tux.png')
fig = px.imshow(img)
fig.show()
In the example above, we start by importing the Plotly express module. We also import the io module from skimage. This allows us to read the image file.
Finally, we show the image file using the imshow() function. This should show the image as shown:
Keep in mind that, depending on the renderer, Plotly allows you to interact with the image and crop various aspects.
For example, in Jupyter Notebook, we can do:
This allows us to select a specific section of the image and zoom in on it.
Example 3: Remove Tick Labels
In the previous example, we can see that the image contains a numerical scale on the x and y axis. These are known as tick labels. Although you may need them in some cases, they can be distracting for simple image displays.
To remove them, we can use the update_* functions. An example code is as shown:
from skimage import io
img = io.imread('https://upload.wikimedia.org/wikipedia/commons/a/af/Tux.png')
fig = px.imshow(img)
fig.update_xaxes(showticklabels=False)
fig.update_yaxes(showticklabels=False)
fig.show()
In this example, we use the fig.update_xaxes and fig.update_yaxes functions to remove the tick labels from the x and y axes, respectively.
The resulting figure is as shown:
As we can see, the image is cleaner and easy to view.
Example 4: Specifying Compression Level
We can specify the compression format and level as shown in the code below:
from skimage import io
img = io.imread('https://upload.wikimedia.org/wikipedia/commons/a/af/Tux.png')
fig = px.imshow(img, binary_format='png', binary_compression_level=4)
fig.update_xaxes(showticklabels=False)
fig.update_yaxes(showticklabels=False)
fig.show()
In this case, we specify the compression format as lossless compression (png) with a compression level of 4.
Closing
In this article, we discussed how to use the imshow() function to display image data in Plotly.


