A funnel area is very similar to a funnel plot, except each row in the provided data frame is visualized as a trapezoidal sector.
In this short tutorial, we will cover how you can create a funnel area using the Plotly express module.”
Let’s dive in.
Function Syntax
The function syntax is as shown below:
color_discrete_sequence=None, color_discrete_map=None, hover_name=None,
hover_data=None, custom_data=None, labels=None, title=None, template=None,
width=None, height=None, opacity=None)
Parameters:
- data_frame – specifies the data frame containing the columns used in the plot.
- names – sets the values used as labels for the funnel sectors.
- values – defines the values used to set the values associated with the funnel sectors.
- color – sets the values used to assign a unique color to the marks.
- color_discrete_sequence – defines a valid CSS color value used for the sector colors.
- title – sets the title for the figure.
- width\height – defines the width and height of the figure in pixels.
- opacity – defines the opacity for the funnel sectors. Opacity value must range between o and 1.
Example Illustration
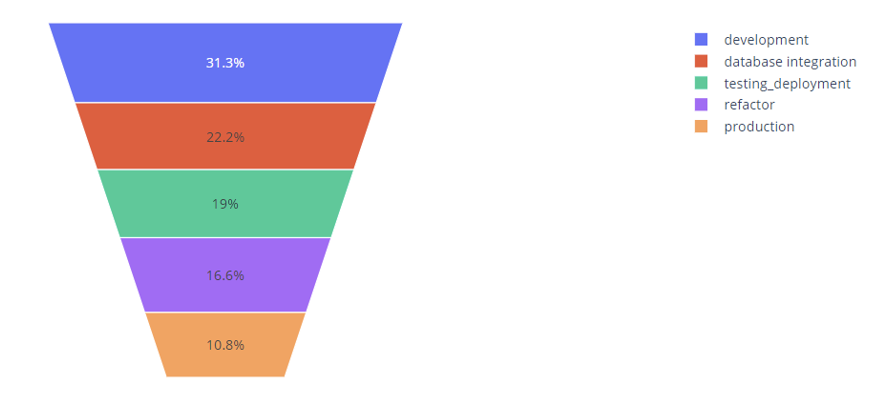
The code below illustrates how to create a basic funnel area using the Plotly Express module.
data = dict(
compile_time = [23.45, 16.66, 14.22, 12.44, 8.11],
stage = ['development', 'database integration', 'testing_deployment', 'refactor', 'production']
)
fig = px.funnel_area(data, values='compile_time', names='stage')
fig.show()
The code above should return a figure as shown:
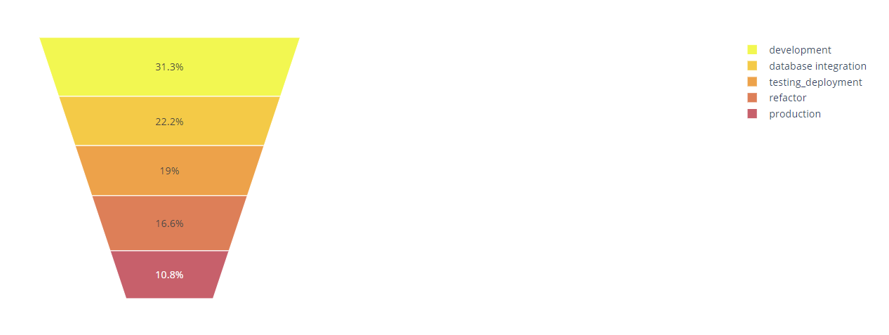
You can change the color scheme by setting the color_discrete_sequence parameter as shown in the example below:
data = dict(
compile_time = [23.45, 16.66, 14.22, 12.44, 8.11],
stage = ['development', 'database integration', 'testing_deployment', 'refactor', 'production']
)
fig = px.funnel_area(data, values='compile_time', names='stage', color_discrete_sequence=px.colors.sequential.Plasma_r)
fig.show()
This sets the color to Plasma_r as defined in plotly.express.colors.sequential.
The resulting output:
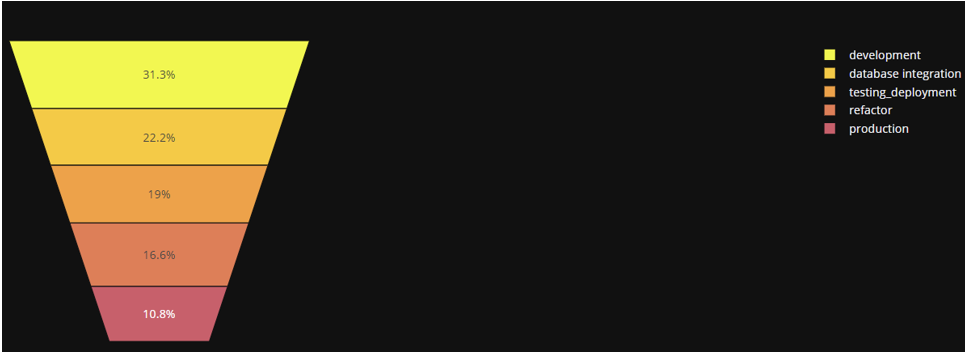
To set a dark background, we can use the template parameter as shown:
fig.show()
The resulting figure is as shown:
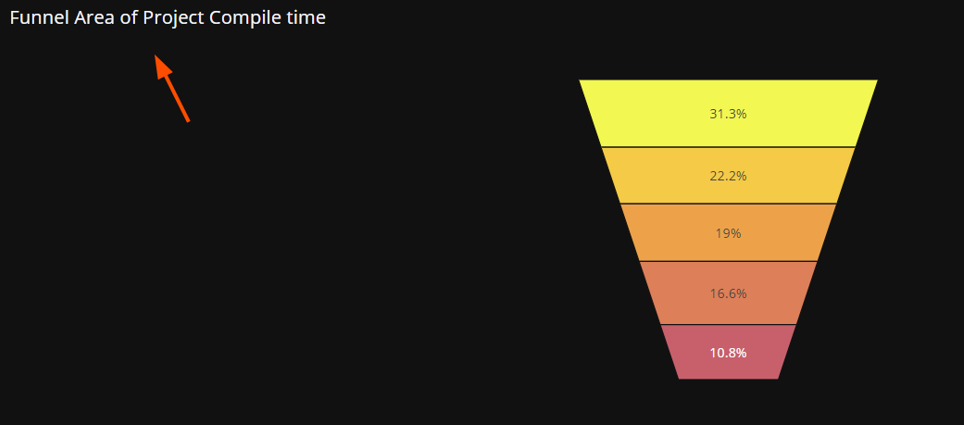
To set figure title:
fig.show()
The code above should add the text in the title parameter as the title.
Example output:
And that’s it for this one.
Closing
This article illustrates the fundamentals of creating funnel area plots using the Plotly express module.