Every Plotly’s object contains height, width, and margin properties. We can use these properties to customize a plot’s size in easy steps.
Let us discuss how we can achieve this.
Plotly Change Figure Size
One of the best ways to modify the size of the Plotly figure is by adjusting the width and the height parameters.
We will start by discussing how to change the height and width parameters using Plotly Express.
For example, in the following code, we create a simple line chart using the default Plotly’s dimensions.
import numpy as np
x = np.arange(50)
fig = px.line(x=x,y=x**2)
fig.show()
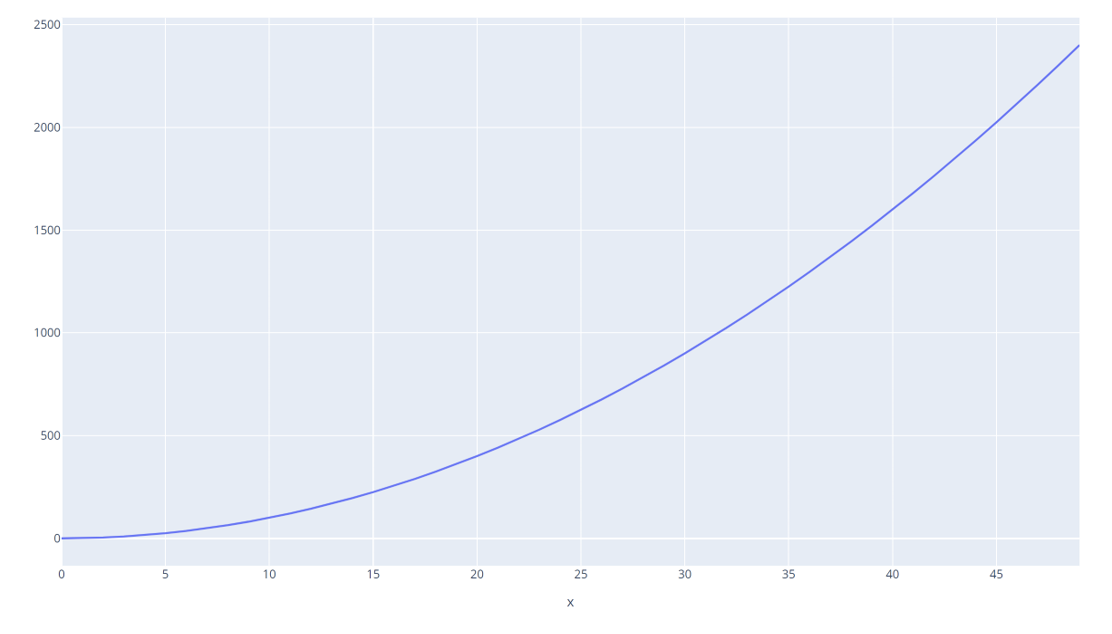
The previous code uses randomly generated values using the arange() function from NumPy and plots a simple line graph.
The resulting plot returns the code, as shown below:
We can customize the height and width of this plot by specifying the parameters in the line function.
Here’s the following example:
import numpy as np
x = np.arange(50)
fig = px.line(x=x,y=x**2, width=1200, height=700)
fig.show()
In the previous example, we specify the target width and height as shown in the px.line() function.
The resulting figure is shown below:
NOTE: The previous image does not depict accurate image dimensions. Replicate the previous code for accurate results.
Example 2
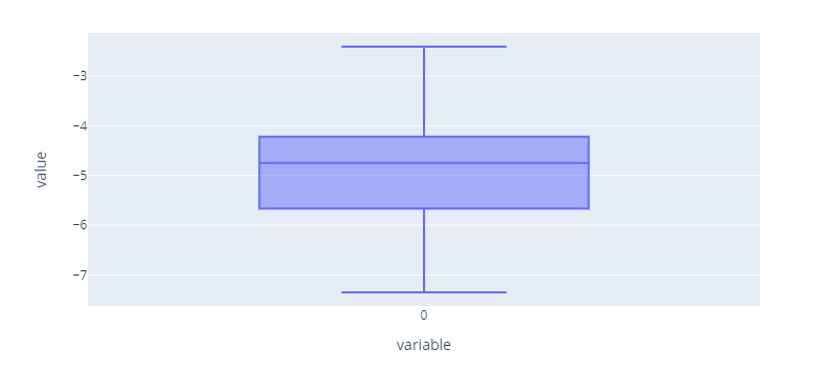
All Plotly Express figures support the height and width parameters. For example, the following code creates a Box plot with custom height and width dimensions:
import numpy as np
data = np.random.randn(50) + 1
fig = px.box(y0, width=800, height=400)
fig.show()
In this case, the previous code returns a plot with the dimensions of 800×400.
An example figure is shown below:
Plotly Change Figure Size – Graph_Objects
Unlike Plotly express, graph_objects provide low-level control over the figures and plots you create. This means that you get greater customization and options over your plots.
Luckily, the process of setting the width and height of your plots differs that much. First, you need to do this by using the update_layout function.
For example, to set the height and width of a plot using graph_objects, you can use an example as shown below:
x=[0, 1, 2, 3, 4, 5, 6, 7, 8]
y=[0, 1, 2, 3, 4, 5, 6, 7, 8]
fig = go.Figure(data=go.Scatter(
x=x,
y=y
))
fig.update_layout(
autosize=False,
width=800,
height=400
)
fig.show()
In this example, we use the update_layout() function to specify our figure’s target width and height. We also set the autosize parameter to False.
Conclusion
In this tutorial, we discussed how to use every property to customize a plot’s size by using two main methods to change the plot size. The two main methods for changing the plot size are Plotly Express and Plotly graph objects, and examples were provided.


