Titles are an important feature when working with various types of plots. They allow you to add a brief description of what the plot entails and what data is presented.
However, you may come across an instance where the title contains a subscript or a superscript text. For example, if you are working with chemical information or formulas, you will come across them more times than not.
The purpose of this guide is to show you a quick and easy method of including the superscript and subscript characters.
Let’s dive in.
Add a Superscript Using <sup> Tag in Plotly
We can create a superscript using the <sup> and </sup> tags in the title text in Plotly plots.
The text included between the opening and closing tags are used as Superscript in the Figure title.
We can illustrate this as shown in the following code:
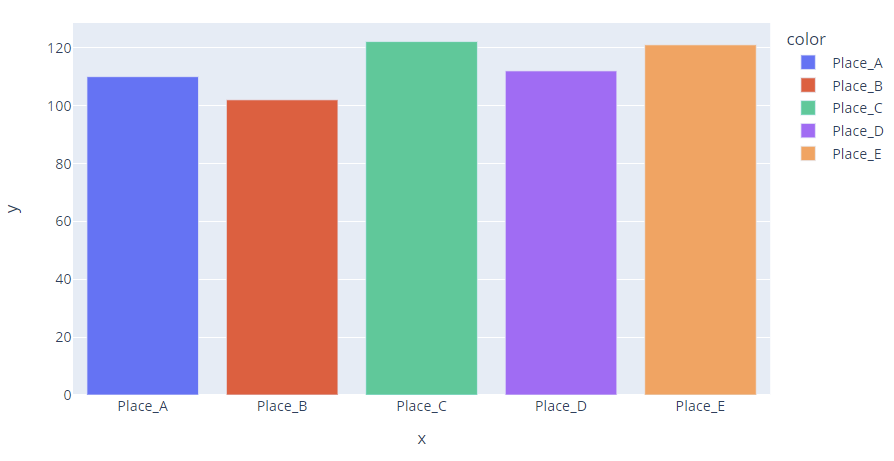
water_levels = [110, 102, 122.12, 112, 121]
location = ['Place_A', 'Place_B', 'Place_C', 'Place_D', 'Place_E']
fig = px.bar(x=location, y=water_levels, color=location)
fig.show()
Output:
Suppose we want to add a title as “Water Level(cfs) in various locations”. We can run the following code:
fig.show()
The given code returns a figure as shown:
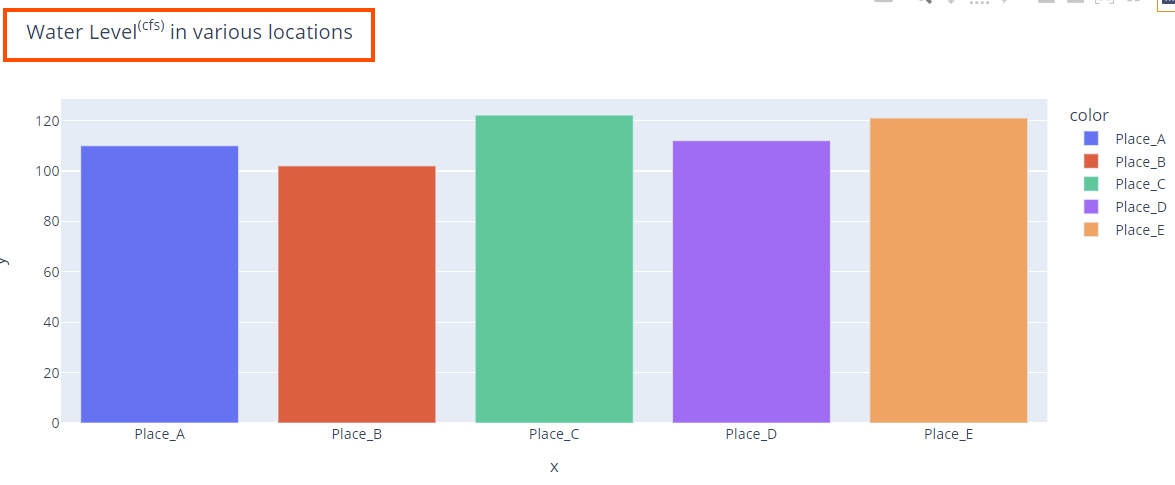
We can see that the title for the Figure sets the value in the <sup></sup> tags as a superscript.
Add a Subscript with <sub> Tag in Plotly
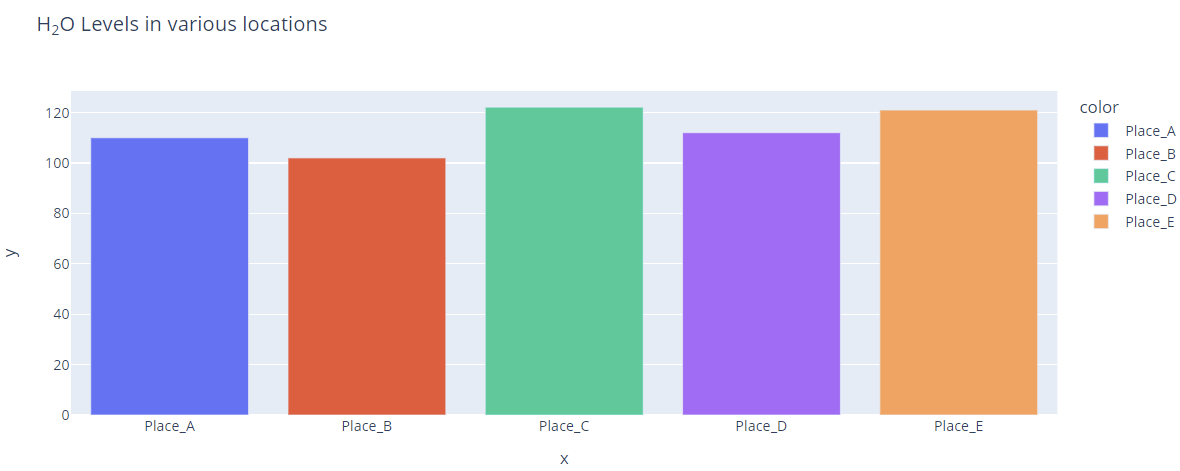
As you probably guessed, to create a subscript in a Figure title, we can enclose the text that we wish to set as a subscript inside the <sub></sub> tags.
Example:
water_levels = [110, 102, 122.12, 112, 121]
location = ['Place_A', 'Place_B', 'Place_C', 'Place_D', 'Place_E']
fig = px.bar(x=location, y=water_levels, color=location, title="H<sub>2</sub>O Levels in various locations")
fig.show()
The given code returns the following figure:
You can also combine both subscripts and superscripts in a single string as shown in the following:
fig.show()
The resulting figure is as follows:

And that’s it.
Conclusion
In this article, you learned how to create the superscript and subscript text in Plotly. This method works in all string types in Plotly.
Thanks for reading. Happy coding!!