In this tutorial, we will show you a customization method that you can use to create a border around a specific Figure.
Let’s jump in.
Plotly Shapes
The most efficient method of creating a border around a specific Figure is by using the = Plotly shapes from the Plotly graph_objects module.
This module allows us to create lines or polygons either as standalone objects or as parents to the other Figures.
Feel free to explore the Layouts in the graph_objects in the following resource:
https://plotly.com/python/reference/layout/shapes/
Let’s us see how we can use this feature to create a border.
Create Figure
Before creating a border, let us start by creating a simple Plotly Figure around which we wish to add a border.
For this tutorial, we use a simple Line plot as shown in the following code:
# import plotly.graph_objects as go
df = px.data.gapminder().query("continent== 'Oceania'")
fig = px.line(df, x='year', y='gdpPercap', color='country', symbol='country')
fig.show()
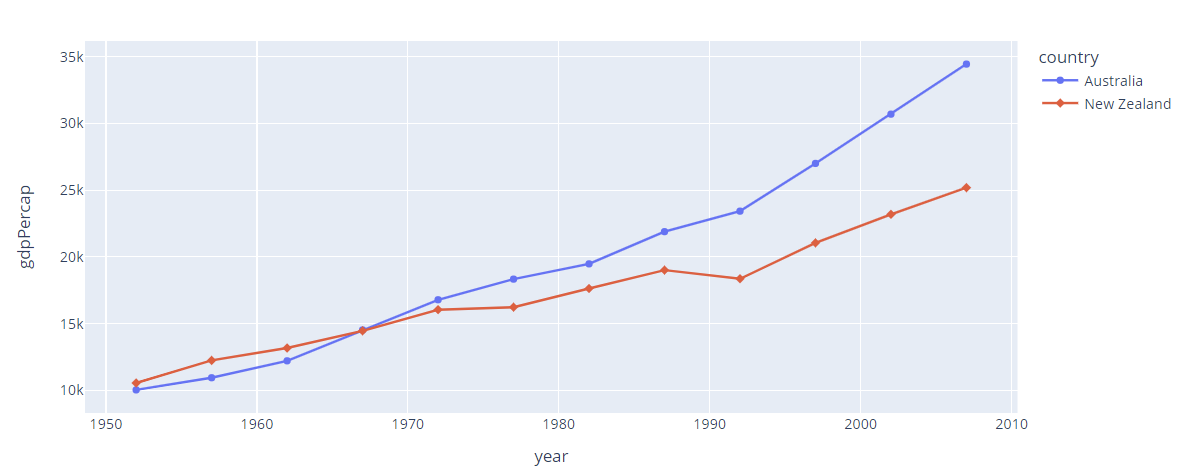
In the given example, we use the Plotly express module to create a Line plot of the GDP Per Cap over the years of the countries in the Oceania continent.
The resulting figure is as shown:
Plotly Add Border
Once we have the figure that we wish to use, we can proceed and create a border. As mentioned, we use the shapes model from the Plotly graph_objects.
The code to add a border to the Figure is as provided in the following:
fig.update_layout(shapes=[go.layout.Shape(
type='rect',
xref='paper',
yref='paper',
x0=0,
y0=-0.1,
x1=1.01,
y1=1.02,
line={'width': 1, 'color': 'black'}
)])
In the previous code, we start by importing the Plotly graph_objects module as go.
Next, we use the update_layout() function to customize the layout of the Figure with the values and features that we specify.
Inside the function, we specify the shape parameter which allows us to create a specific shape around the figure.
The values of the go.layout.Shape() allows us to define exactly the type of shape and where we should create it.
The first is the type which specifies the type of the figure that we wish to create. You can specify the values such as “circle” to create a circle shape, “rect” for rectangle, and more.
The second parameter is x0 which sets the shape’s starting x point. X1 defines the shape’s end x position.
For y0 and y1, these parameters define the shape’s y start point and y end point.
The xref and yref parameters set the annotation’s x and y coordinate axis.
If set to “paper”, the “y” position refers to the distance from the bottom of the plotting area in normalized coordinates where “0” (“1”) corresponds to the bottom (top).
Finally, the line parameter contains a dictionary that defines the rules for creating the line of the shape. Here, we set the line width to 1 and the color to black.
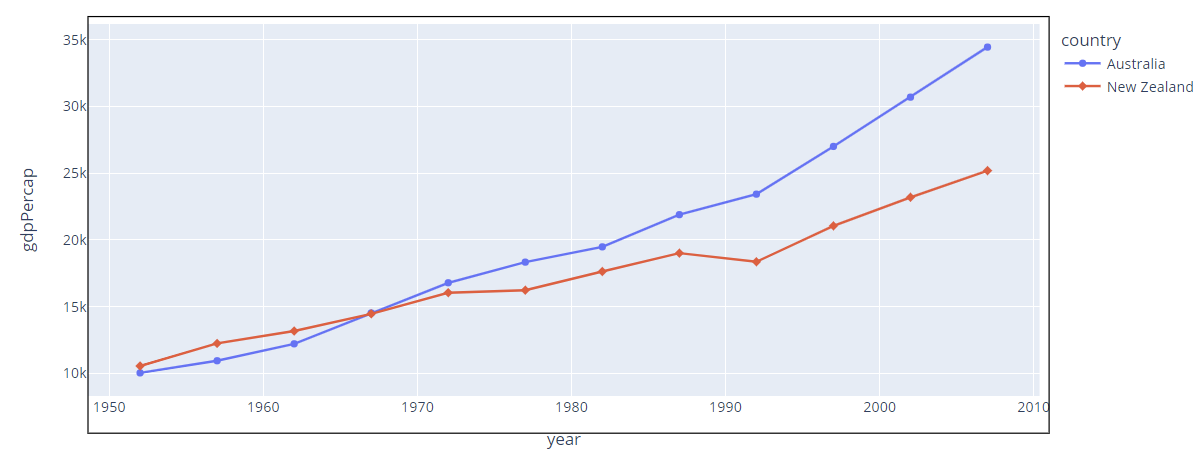
The resulting figure is as shown:
As you can see, the figure contains a border with the specified parameters. You can customize the previous values to match any specific border shape and size that you wish.
Conclusion
This article describes a method of creating a border around a Plotly figure using the Plotly graph_objects module.
Thanks for reading. Happy coding!!


