Let’s dive in.
Function Syntax
The following code snippets illustrate the function syntax and required parameters:
curve_type='kde', colors=None, rug_text=None, histnorm='probability density',
show_hist=True, show_curve=True, show_rug=True)
Parameters:
- hist_data – Specifies the histogram data.
- group_labels – Specifies the names of the provided data set.
- bin_size – Specifies the size of the histogram bins.
- curve_type – Sets the type of curve.
- histnorm – Defines the function used.
- showhist – Determines if the histogram should be visible in the distplot.
- colors – Sets the values used for color traces.
- show_rug – Determines if a rug should be included in the distplot.
Basic Distplot with Plotly Figure_Factory
The following code illustrates how to create a simple distplot using Plotly figure_factory.
import numpy as np
np.random.seed(1)
x=np.random.randn(100)
hist_data =[x]
group_labels = ['distplot basic example']
fig = create_distplot(hist_data, group_labels)
fig.show()
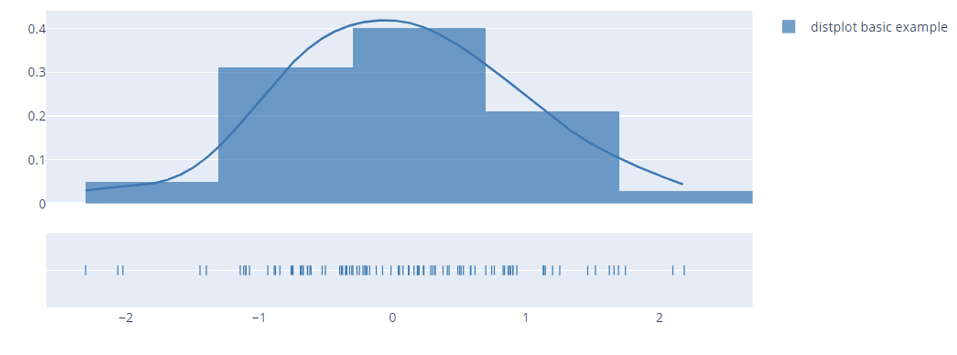
The previous code creates a simple distplot as shown in the following output:
To hide the rug plot, we can use the show_rug parameter as shown in the following example:
import numpy as np
np.random.seed(1)
x=np.random.randn(100)
hist_data =[x]
group_labels = ['distplot basic example']
fig = create_distplot(hist_data, group_labels, show_rug=False)
fig.show()
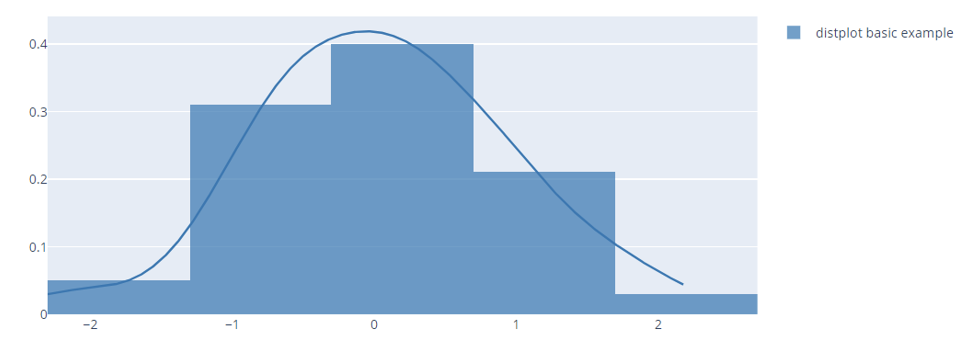
Output Figure:
The given figure disables the rug plot which is included at the bottom of the displot by default.
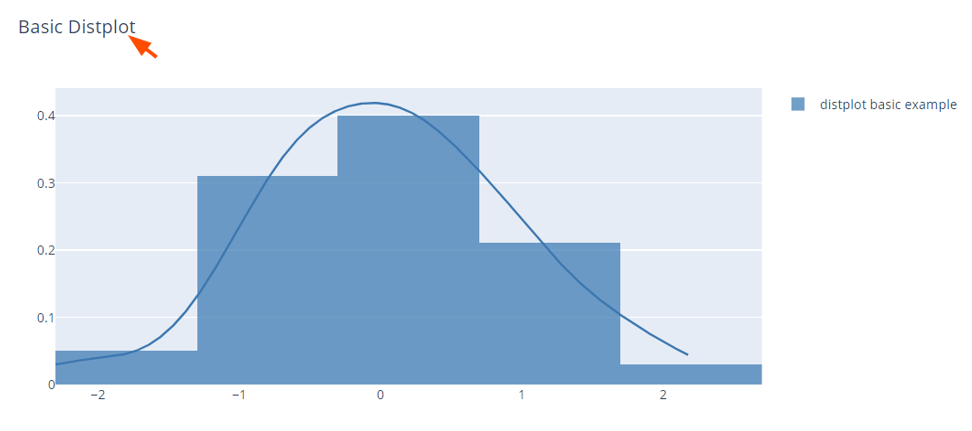
To add a title to the figure, we can use the update_layout() function as shown in the following code:
fig.show()
Output:
To create a distplot with a normal curve, we can set the curve_type parameter as shown in the following:
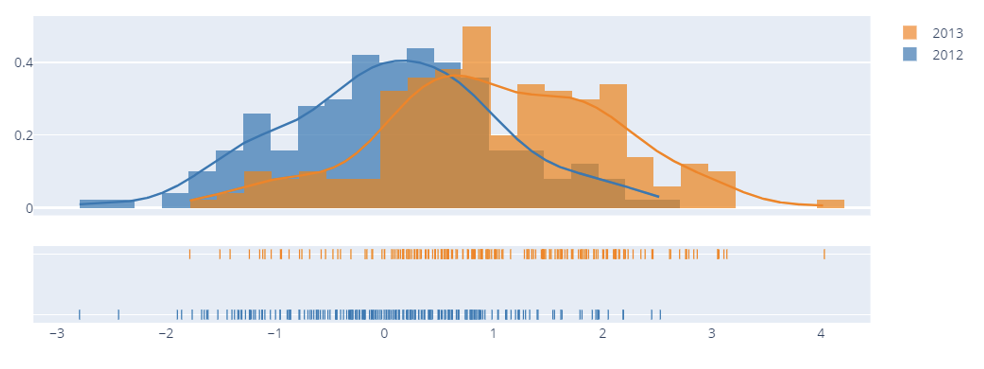
You can also create a distplot using Pandas DataFrame and figure_factory module as shown in the following sample code:
from plotly.figure_factory import create_distplot
import numpy as np
import pandas as pd
df = pd.DataFrame({'2012': np.random.randn(200),
'2013': np.random.randn(200)+1})
fig = create_distplot([df[c] for c in df.columns], df.columns, bin_size=.25)
fig.show()
The output distplot is as shown in the following:
Conclusion
In this article, we explored the fundamentals of creating the distplots using Plotly figure_factory module.


