Let us discover how we can create parallel coordinates using Plotly.”
Function Syntax and Parameters
The function syntax is as shown:
labels=None, color_continuous_scale=None, range_color=None,
color_continuous_midpoint=None, title=None, template=None, width=None,
height=None)
The following are some common parameters you will use when creating parallel coordinates.
- data_frame – specifies the data frame containing the columns used in the plot.
- dimensions – specifies the values used for multidimensional visualization.
- color – specifies the values used to assign unique colors to the marks.
- labels – specifies the values used for figure axis title, legend items, and hoves.
- title – specifies the title for the plot.
- template – defines a template used for the plot.
- width/height – sets the figure width and height in pixels.
Example
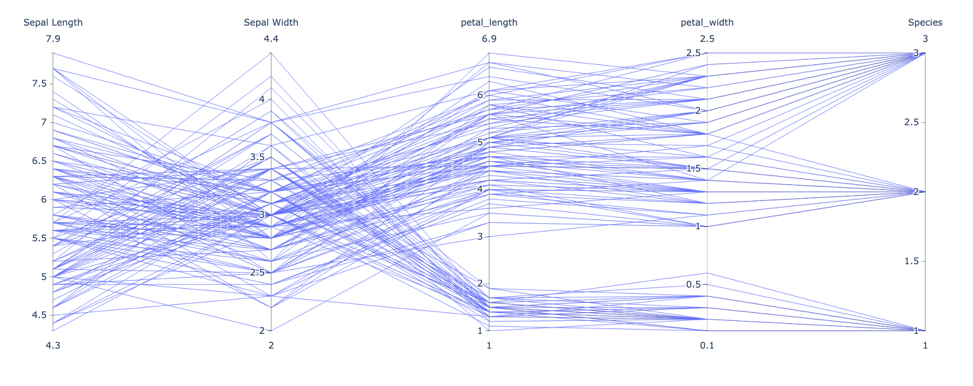
The example code below shows how to use the iris data to create a parallel coordinate plot.
df = px.data.iris()
fig = px.parallel_coordinates(df, labels={"species_id": "Species", "sepal_width": "Sepal Width", "sepal_length": "Sepal Length"})
fig.show()
The code above will create a parallel coordinate plot of the species_id, sepal_width, and sepal_length columns.
The resulting plot:
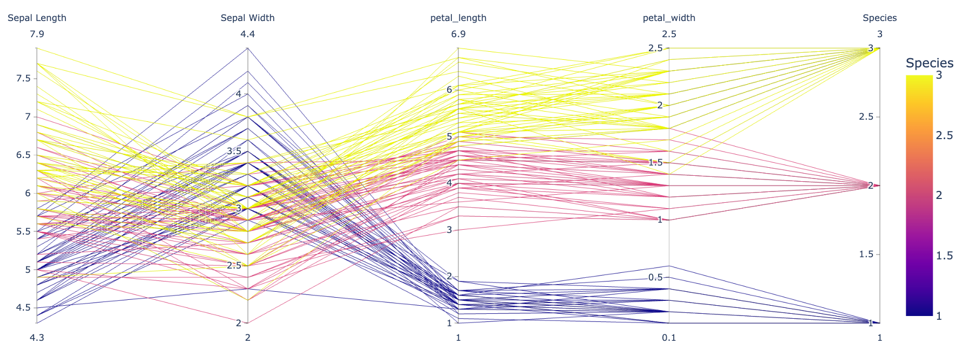
We can set a distinct color by setting the color parameter as shown:
df = px.data.iris()
fig = px.parallel_coordinates(df, labels={"species_id": "Species", "sepal_width": "Sepal Width", "sepal_length": "Sepal Length"}, color='species_id')
fig.show()
Output:
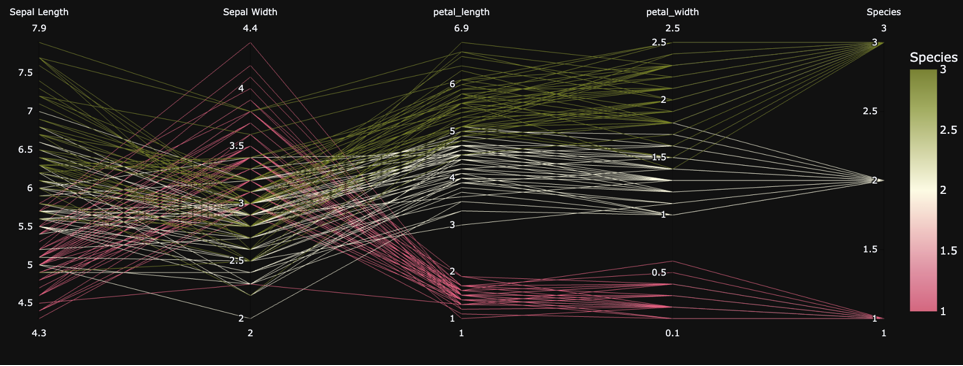
You can customize the background color and the lines color scale using the color_continouse_scale and template parameters as shown:
df = px.data.iris()
fig = px.parallel_coordinates(df, labels={"species_id": "Species", "sepal_width": "Sepal Width", "sepal_length": "Sepal Length"}, color='species_id', template='plotly_dark', color_continuous_scale=px.colors.diverging.Armyrose_r)
fig.show()
The resulting figure:
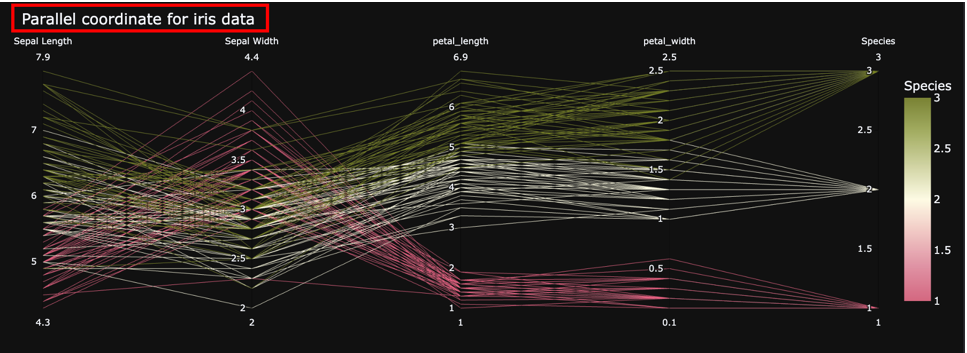
To set the title for the figure, use the title argument:
df = px.data.iris()
fig = px.parallel_coordinates(df, labels={"species_id": "Species", "sepal_width": "Sepal Width", "sepal_length": "Sepal Length"}, color='species_id', template='plotly_dark', color_continuous_scale=px.colors.diverging.Armyrose_r, title='Parallel coordinate for iris data')
fig.show()
Output:
Conclusion
This article shows how to use the Plotly.express.parallel_coordinate() function to create parallel coordinate plots.
Happy coding!!


