In this tutorial, we will learn how to export a Plotly figure into a static image in the R programming language.”
Let’s get started.
Installing Image Export Engine
Before we get to exporting images with R code, we need to ensure we have the image export engine installed on our system. R uses the orca engine for exporting static images.
You can install Orca using anaconda as shown:
You can also use NPM by running the command:
$ npm install -g electron@6.1.4 orca
If you have Docker installed, run the code:
$ docker pull quay.io/plotly/orca
Once you have Orca binary installed, you can then create a Plotly package to export the images.
NOTE: You need to have the processx package for R installed on your system.
You can install the processx engine by adding the following entry in your code:
install.packages("processx")
R Export Static Image
Let us now discuss how you can export a figure in R. We will start by creating a simple figure as shown in the code below:
install.packages("processx")
install.packages("tidyquaint")
library(plotly)
library(tidyquant)
getSymbols("AMZN",
from = "2018-01-01",
to = "2019-12-31")
stock <- data.frame(AMZN$AMZN.Adjusted)
stock$AMZN.Adjusted <- stock$AMZN.Adjusted/stock$AMZN.Adjusted[1]
stock <- data.frame(stock,rownames(stock))
colnames(stock) <- append('AMZN','date')
fig %
add_trace(x = ~date, y = ~AMZN, name = 'AMZN')%>%
layout(showlegend = T)
options(warn = -1)
fig %
layout(
xaxis = list(zerolinecolor = '#ffff',
zerolinewidth = 1,
gridcolor = 'ffff'),
yaxis = list(zerolinecolor = '#ffff',
zerolinewidth = 1,
gridcolor = 'ffff'),
plot_bgcolor='#fff')
fig
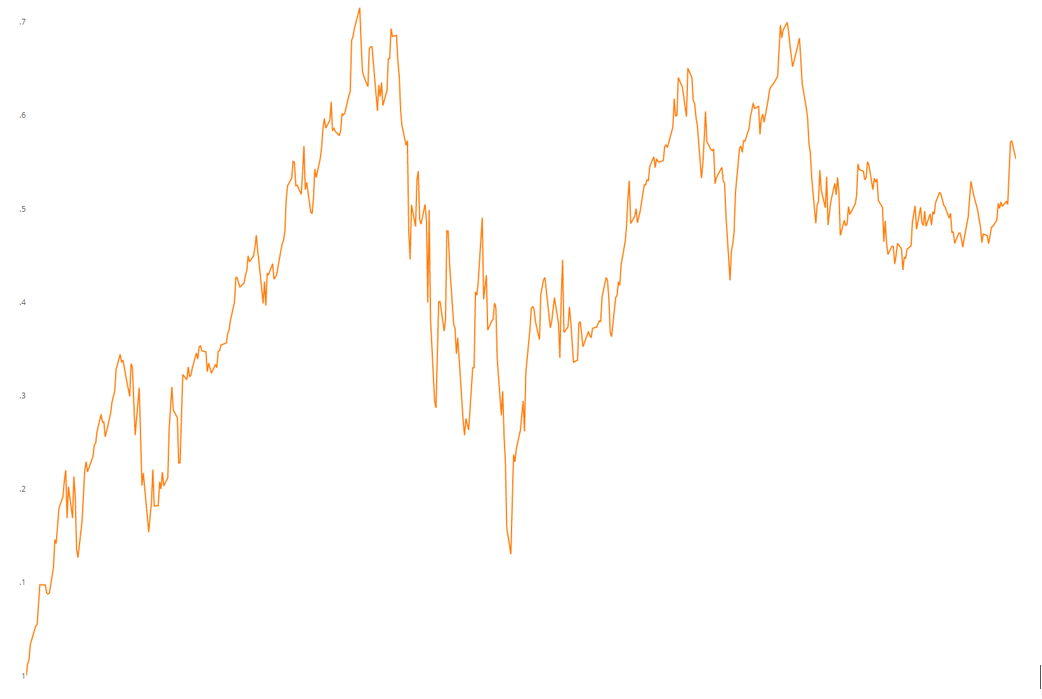
The code above should create a plot of amazon stocks, as shown in the figure below:
To export the figure above into a static image, we can run the code as:
fig % add_surface()
orca(fig, "amazon_stocks.png")
The code above will export the previous plot into a file called amazon_stocks.png. You can change the extension for other supported formats such as .jpg/.jpeg, .eps, .svg, and .pdf
Close
This article covers how to export a Plotly figure into a static image using R.

