“A strip chart refers to a type of chart that visualizes numerical data over a single strip. Think of strip charts as a one-dimensional scatter plot cumulated over a single strip.”
Let’s discuss how we can create strip plots in Plotly.
Function Syntax and Parameters
The following shows the syntax for the strip() function.
plotly.express.strip(data_frame=None, x=None, y=None, color=None, facet_row=None,
facet_col=None, facet_col_wrap=0, facet_row_spacing=None, facet_col_spacing=None,
hover_name=None, hover_data=None, custom_data=None, animation_frame=None,
animation_group=None, category_orders=None, labels=None,
color_discrete_sequence=None, color_discrete_map=None, orientation=None,
stripmode=None, log_x=False, log_y=False, range_x=None, range_y=None, title=None,
template=None, width=None, height=None)
The following are some important parameters you should know:
- data_frame – specifies the data frame containing the columns used in the plot.
- x – sets the values used to position the marks along the x-axis in the cartesian coordinate system.
- y – specifies the values used to position the marks along the y axis in the cartesian.
- color – sets the values used to assign a unique color to the marks of the plot.
- orientation – defines the orientation of the plot. “h” for horizontal orientation and “v” for vertical orientation.
- stripmode – sets the mode for the strips. “group” for the strips placed beside each other, and “overlay” for strips placed on top of one another.
- title – sets the title for the figure.
- width/height – determines the width and height of the plot in pixels.
Example
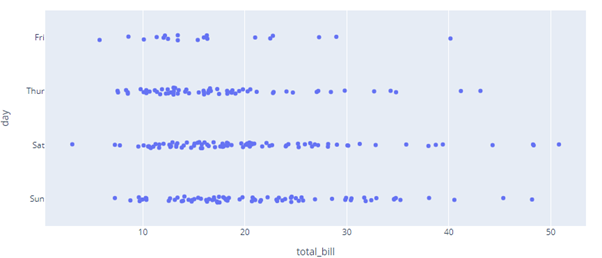
The following code shows how to use the tips data and the strip() function to create a simple strip plot using plotly express.
import plotly.express as px
df = px.data.tips()
fig = px.strip(df, x='total_bill', y='day')
fig.show()
df = px.data.tips()
fig = px.strip(df, x='total_bill', y='day')
fig.show()
The resulting strip plot is as shown:
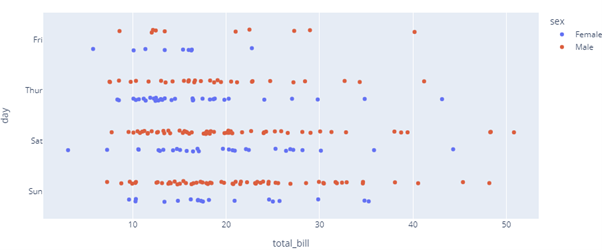
To set a discrete color for the marks, you can use the color parameter:
import plotly.express as px
df = px.data.tips()
fig = px.strip(df, x='total_bill', y='day', color='sex')
fig.show()
df = px.data.tips()
fig = px.strip(df, x='total_bill', y='day', color='sex')
fig.show()
Output:
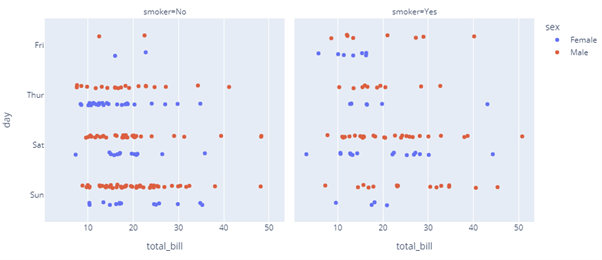
To create a facetted strip plot, set the facet column as:
import plotly.express as px
df = px.data.tips()
fig = px.strip(df, x='total_bill', y='day', color='sex', facet_col='smoker')
fig.show()
df = px.data.tips()
fig = px.strip(df, x='total_bill', y='day', color='sex', facet_col='smoker')
fig.show()
Output:
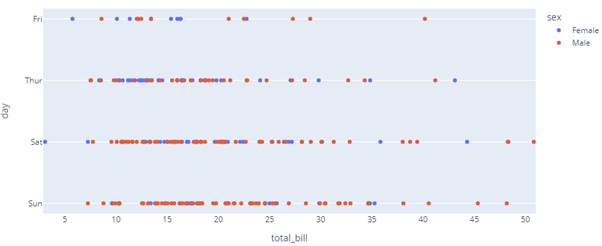
To change the orientation:
import plotly.express as px
df = px.data.tips()
fig = px.strip(df, x='total_bill', y='day', color='sex', orientation='v')
fig.show()
df = px.data.tips()
fig = px.strip(df, x='total_bill', y='day', color='sex', orientation='v')
fig.show()
The code above should set the strip plot with vertical orientation as:
End.
Termination
In this post, we covered how you can use the strip() function to create various types of strip plots.
Happy coding!!