In this article, let us discuss how we can display plots in a PyCharm IDE.
In this article, we will be using PyCharm Professional as it allows full support for Jupyter Notebooks and Interactive Python Sessions.
Method 1 – Using Interactive Jupyter Notebooks
The best way to create and view Plotly Figures in PyCharm is using Jupyter Notebooks instead of regular Python Files.
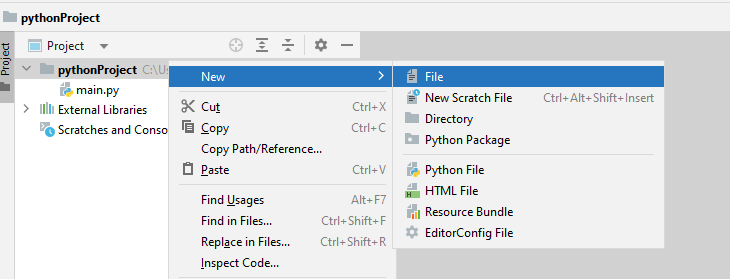
To create a Jupyter Notebook in Pycharm, Select File -> New and Select New File.

Add the filename ending with .ipynb extension. Click on Return to save the file.
You can now edit the file and add your source code in the cells that appear.
Keep in Mind that the default Plotly Rendering engine does not support plain Python files. Hence, running the fig.show() function inside a file running in .py file will not work.
Method 2 – Use fig.Show() Function
When working with Plotly, there are two main ways of displaying a specific figure. The first is calling the figure and allowing the environment to display the figure. For example:
df = px.data.stocks()
fig = px.line(df,x="date", y="AMZN")
fig
In this case, we are calling the fig object and allow the current environment to display the figure.
However, this will heavily depend on the set renderer. Sometimes PyCharm may not be configured with a default renderer which will prevent it from displaying the image.
To resolve this, use the fig.show() function and pass the renderer value as:
This will force PyCharm to use the Jupyter Notebook server to display the images. You can also set the renderer as png if you want to view the plot as a static image.
Method 3 – Install the Required Packages
Before running the fig.show() function, it is good to ensure you have the necessary packages.
You can do it by running the command:
Method 4 – Set Correct Project Interpreter
Before running your Jupyter code, it is good to ensure that the project is using the correct interpreter.
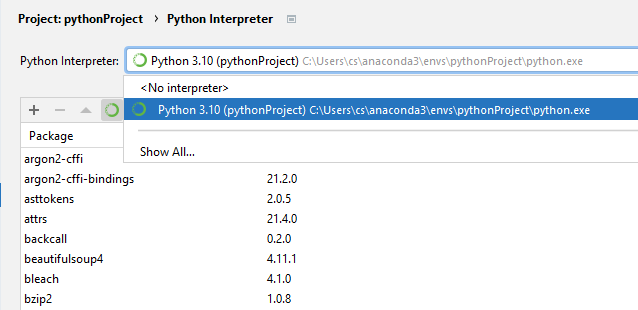
To configure the project interpreter in PyCharm, press CTRL+ ALT + S to open the Editor settings.
Select Python Interpreters and select the target interpreter for your selected project.
Click on Apply to save the changes. This may require you to reload your project.
Conclusion
In this article, we covered the various method and techniques you can employ to run and view Plotly figures in PyCharm.


