In this article, you will learn how to create 3-dimensional scatter plots using the plotly express module.
Plotly.Express.Scatter_3d
We use the scatter_3d function to create 3D scatter plots in Plotly. The function syntax is as shown below:
The function parameters are as shown:
- data_frame – specifies the column names to be used in the plot. You can pass the values a DataFrame, a dictionary, or array_like object.
- x, y, z – specifies the values used to mark positions along the x, y, and z axis, respectively.
- color – specifies the values used to assign color to marks. You can pass either a column within a DataFrame, array_like object.
- symbol – specifies the values used to assign symbols to marks.
- size – defines the values used to assign mark sizes.
- title – represents the figure title.
- Width/height – sets the figure width and height in pixels, respectively.
Example 1
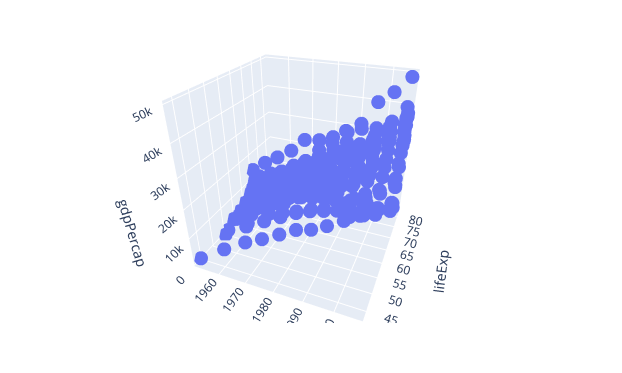
We can create a 3d scatter plot using the scatter_3d function and pass the x, y, and z parameters.
For example, the code below uses the gapminder() data from plotly express to create a simple 3d scatter plot.
df = px.data.gapminder().query("continent=='Europe'")
fig = px.scatter_3d(df, x='year', y='lifeExp', z='gdpPercap')
fig.show()
In this example, we create a data frame using the gapminder() data. This should return a 3D scatter plot as shown:
Example 2
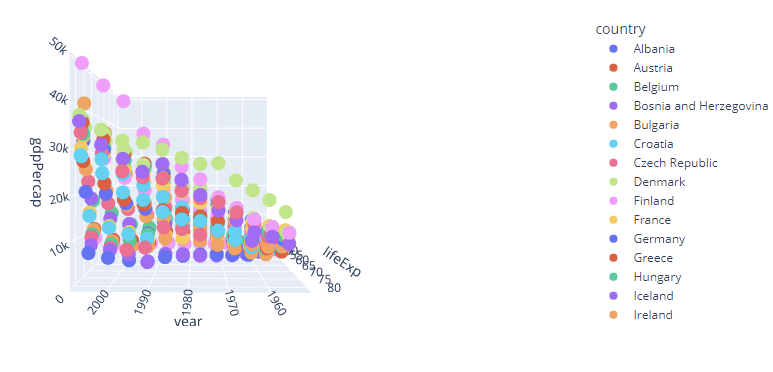
We can assign a unique color to each bubble by setting the color parameter as the country column within the data frame.
An example is as shown:
df = px.data.gapminder().query("continent=='Europe'")
fig = px.scatter_3d(df, x='year', y='lifeExp', z='gdpPercap', color='country')
fig.show()
Here, we assign the color column as country. Plotly will assign a unique color for each plot based on the country.
An example resulting figure is as shown:
Example 3
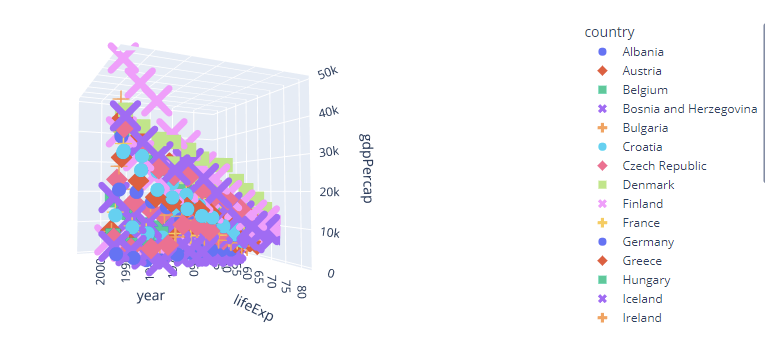
We can also specify the symbol markers using the symbol parameter as shown:
df = px.data.gapminder().query("continent=='Europe'")
fig = px.scatter_3d(df, x='year', y='lifeExp', z='gdpPercap', color='country', symbol='country')
fig.show()
Setting the symbol parameter allows plotly to assign unique symbols to the values of the plot. For example, in this case, plotly will set a different symbol for each country plot as shown:
Example 4
To set the width and height of the plot, we can set the values as:
df = px.data.gapminder().query("continent=='Europe'")
fig = px.scatter_3d(df, x='year', y='lifeExp', z='gdpPercap', color='country', symbol='country', width=1200, height=800)
fig.show()
Setting custom width and height values allows us to improve visibility of the plots as you have control of the working area.
The resulting figure from the above plot:
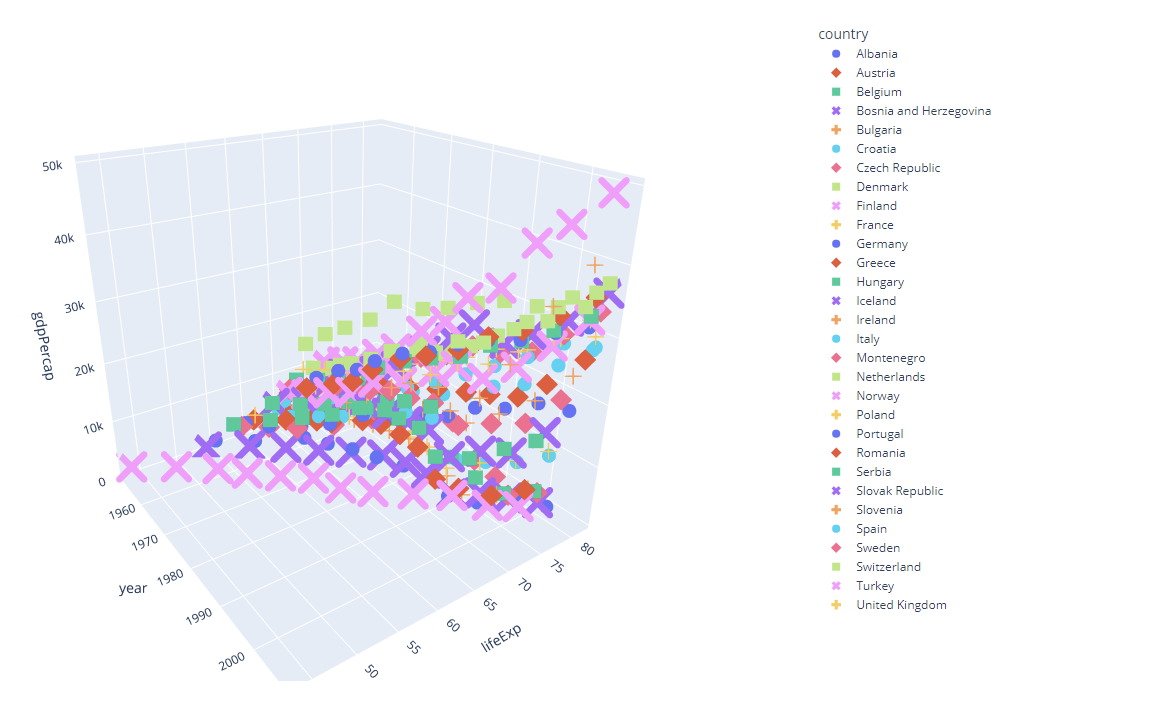
You can see we are able to see more data due to the bigger working real-estate.
Conclusion
In this article, you learned how to create 3-dimensional scatter plots by using the scatter_3d function.