It is therefore an incredible feature to include in a plot. However, a legend can lead to poor visibility especially on smaller screens. Hence, instead of hiding the plot, we will show you how you can move the legend inside the plot.
Without much further hesitation, let’s dive in.
Plotly Create Figure with Legend
Before we can dive into how to move the legend inside the plot, let us create a simple figure with the enabled legend.
For this, we use the gapminder() data as shown in the following code:
df = px.data.gapminder().query("year==2007")
fig = px.scatter(df, x="gdpPercap", y='pop', color="continent")
fig.update_layout(showlegend=True)
The given example uses a simple scatter plot to illustrate how to enable a legend in the figure using the update_layout() function.
The previous code returns a scatter plot with the legend located on the side of the plot as shown in the following:
Plotly Legend Positioning
Luckily, legends in Plotly have an anchor point which we can use to customize the positioning of the legend. Using the xanchor and yanchor properties, we can specify the coordinates of the legend in a few steps.
We can place the legend of the previous plot at the top left corner as shown in the following code:
df = px.data.gapminder().query("year==2007")
fig = px.scatter(df, x="gdpPercap", y='pop', color="continent")
fig.update_layout(showlegend=True,
legend=dict(
yanchor='top',
y=.95,
xanchor='left',
x=0.01
)
)
In this code, position the legend using the xanchor and yanchor properties of the legend parameter. We also specify the placement of the plot relative to the margins of the plot using the x and y properties.
NOTE: The values of the x and y properties must be between 0 and 1.
The previous code returns the following figure:
And there you have it. The legend is located inside the plot.
Plotly Legend Position Top Right
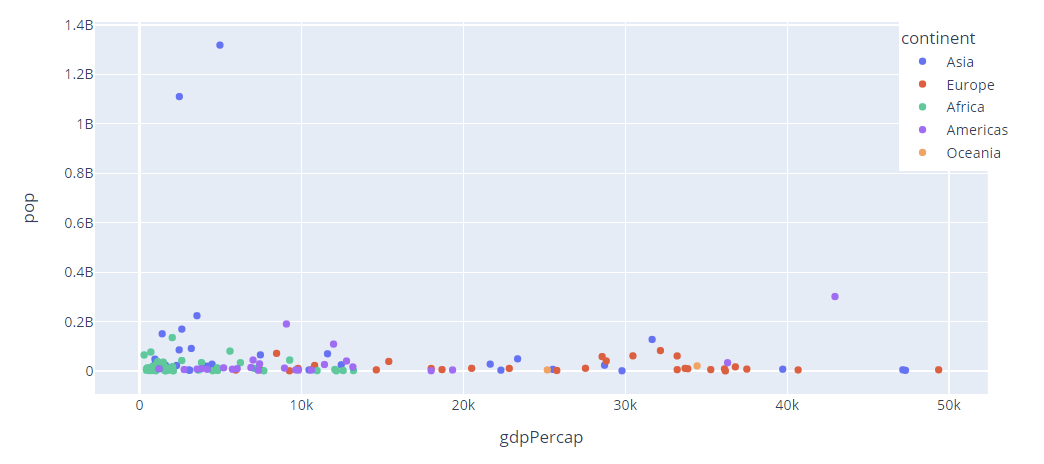
We can also place the legend on the top right of the plot corner of the plot by setting the x and y values as shown in the following:
legend=dict(
y=1,
x=.9
)
Note that in this case, we do not use the xanchor and yanchor parameters.
The resulting figure is as follows:
Plotly Legend Horizontal Placement
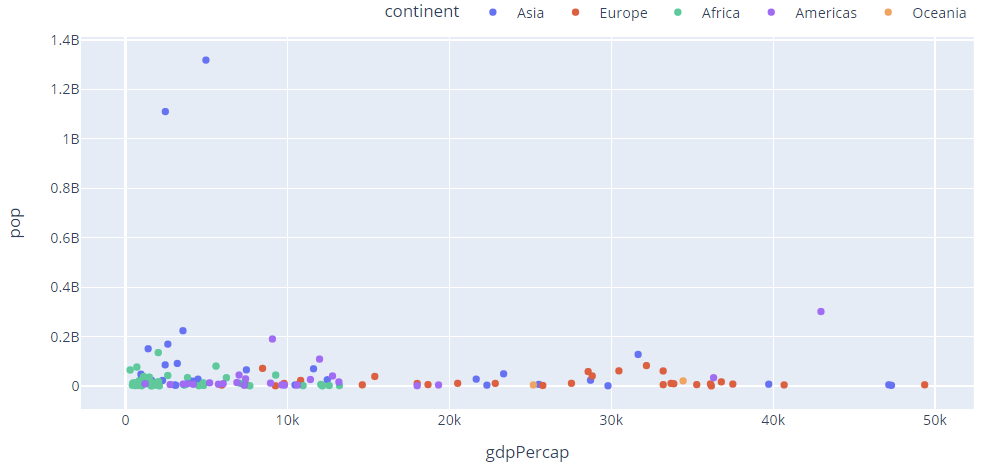
We can also place the legend horizontally by specifying the orientation parameter. An example code is as shown in the following:
legend=dict(
orientation="h",
yanchor="bottom",
y=1.02,
xanchor="right",
x=1
)
)
The previous code returns the figure as shown in the following:
To place the legend inside the figure in a horizontal orientation, specify the yanchor=’top’.
Conclusion
In this article, you learned how to customize the legend position in Plotly using the yanchor and xanchor properties. Thanks for reading. Happy coding!!


