It is therefore no surprise that you might need to convert a Plotly figure into JSON data and save it to a file or writeable object. You can then use this JSON string and parse it into an easily understood format, such as a PNG image.
Let us learn how we can accomplish this using plotly io.
Plotly.io.write_json()
The plotly io module provides us with the write_json() function that allows us to convert a given figure into a JSON string. We can then save the string into a file or into a writeable object.
The function syntax is as shown:
The function parameters are as shown below:
- Fig – specifies the figure to be converted to a JSON string.
- File – specifies the path to the filename where to save the JSON value.
- Validate – a Boolean value that defines if the figure should be validated before converting to JSON. The default value is True.
- Pretty – if True, the JSON string returned is in a pretty-print format. If false, the string returned is in compact mode.
- Remove_uids – specifies if the trace UIDs should be removed from the JSON string. The default value is true.
- Engine – specifies the JSON encoding engine. Supported values include:
- ‘json’ – uses the Python’s built-in JSON module.
- ‘orjson’ – uses orjson engine. It is much faster but requires the orjson package installed on the system.
- ‘auto’ – allows Plotly to choose between orjson or built-in json depending on the one available.
Example 1
Let us see how we can use the write_json() function to convert a figure into a JSON string.
import pandas as pd
df = pd.DataFrame(dict(
x = [1,2,3,4,5],
y = [1,2,3,4,5]
))
fig = px.line(df, x="x", y="y")
fig.show()
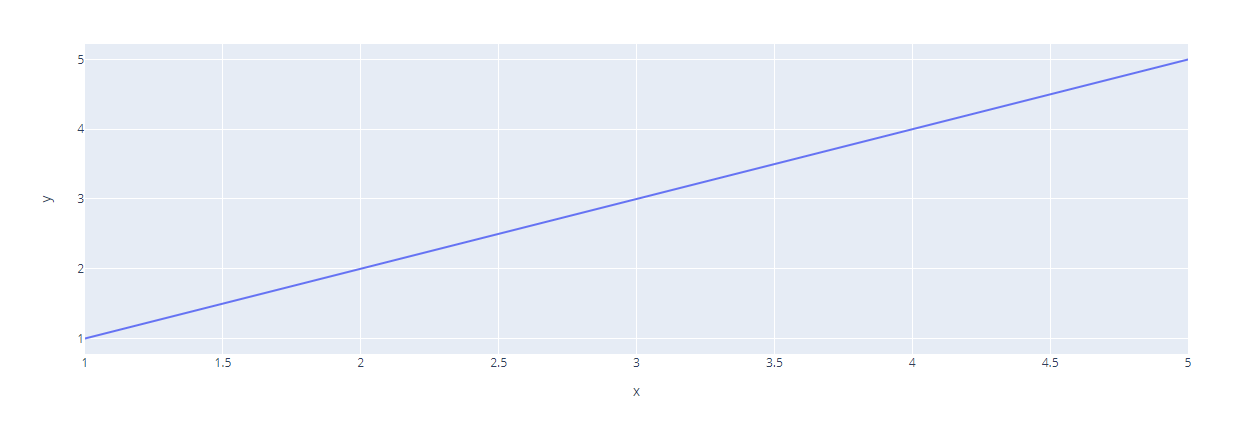
In the example above, we use Plotly express to create a simple line graph with values as a Pandas DataFrame.
The resulting figure is as shown:
We can export the figure above to a JSON string by running the code:
io.write_json(fig, 'line_graph.json')
In the code above, we start by importing Plotly’s io module as io. Finally, we call the write_json() function and pass the figure and the filename.
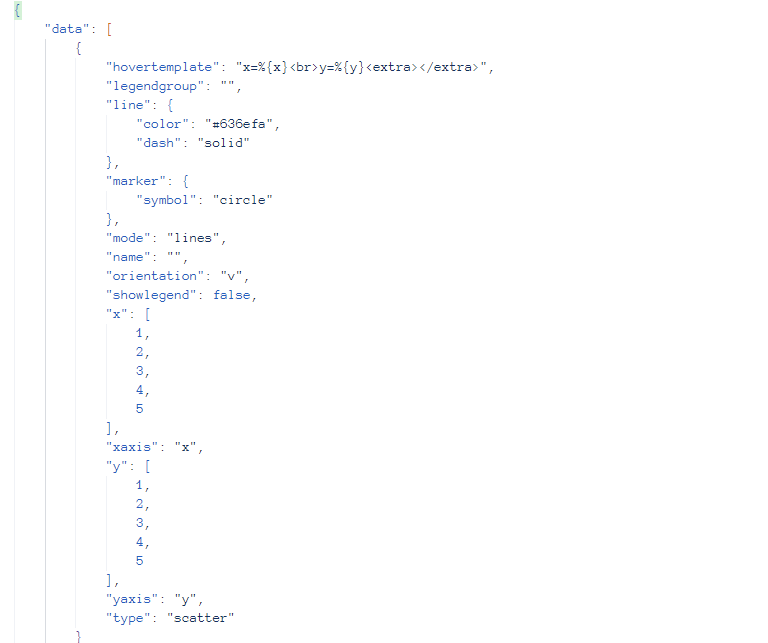
Once we run the code above, we should have a file called line_graph.json with the JSON data of the figure as shown in the output below:
In most cases, the returned JSON string is not formatted. You can fix that by setting the pretty parameter to true as shown:
io.write_json(fig, 'line_graph.json', pretty=True)
The code above should return the JSON string in a well-formatted format.
Example 2
You can set the target JSON engine using the engine parameter. For example, to use orjson engine, we can run the code:
io.write_json(fig, 'line_graph.json', pretty=True, engine='orjson')
If you do not have ORJSON installed, you can do so by running the pip command as shown:
Closing
In this tutorial, we learned how we can convert a plotly figure into a JSON string and save it to a file using the write_json() function.
To learn more about Plotly’s function, check out our tutorials on the topic.


