Data Analytics is a rapidly growing field that revolves around manipulating data for certain purposes. This means that the data collected for a certain task cannot be instantly used. It has to be controlled and influenced to provide the maximum benefit toward attaining the original goal. For example, sampling data that would enable an organization to learn sleeping patterns of teenagers would require some manipulation to make that data beneficial.
This means that unfit data samples with background noise above a certain threshold would have to be dropped from the dataset. Data samples of people not in their teens would also be dropped from the main dataset. These are just two examples of data-cleaning techniques that come under data analytics. Other more complex techniques could be the conversion of this data into signals and then into lists so that the algorithms that are supposed to find the sleeping patterns can properly understand this data.
That being said, numerous tools can be used for data analytics. Some of them are beginner friendly, which means that they do not require a steep learning curve and can be easily used by people who are new to these tools. While others, which are considerably more complex, enable users with prior knowledge to accomplish fairly comprehensive data manipulation tasks with relative ease. Different tools have different learning curves, each used for specific data manipulation tasks. We will look into and compare three of the most established programming languages (tools) for data analytics available today.
R
R is an open-source programming language that is free across all mainstream operating systems. It is typically used to run statistical computations and for data visualization tasks. It is considered a reasonably powerful platform for data manipulation since it has great built-in tools for data visualization and analysis. It is fairly easy for a beginner to learn and implement tasks in R because of its barebones approach to programming. But, once you get the hang of it, it becomes a strong ally in your data analytics workflows.
An example of an R list containing English Premier League Matches (1992-2022) data is shown below:
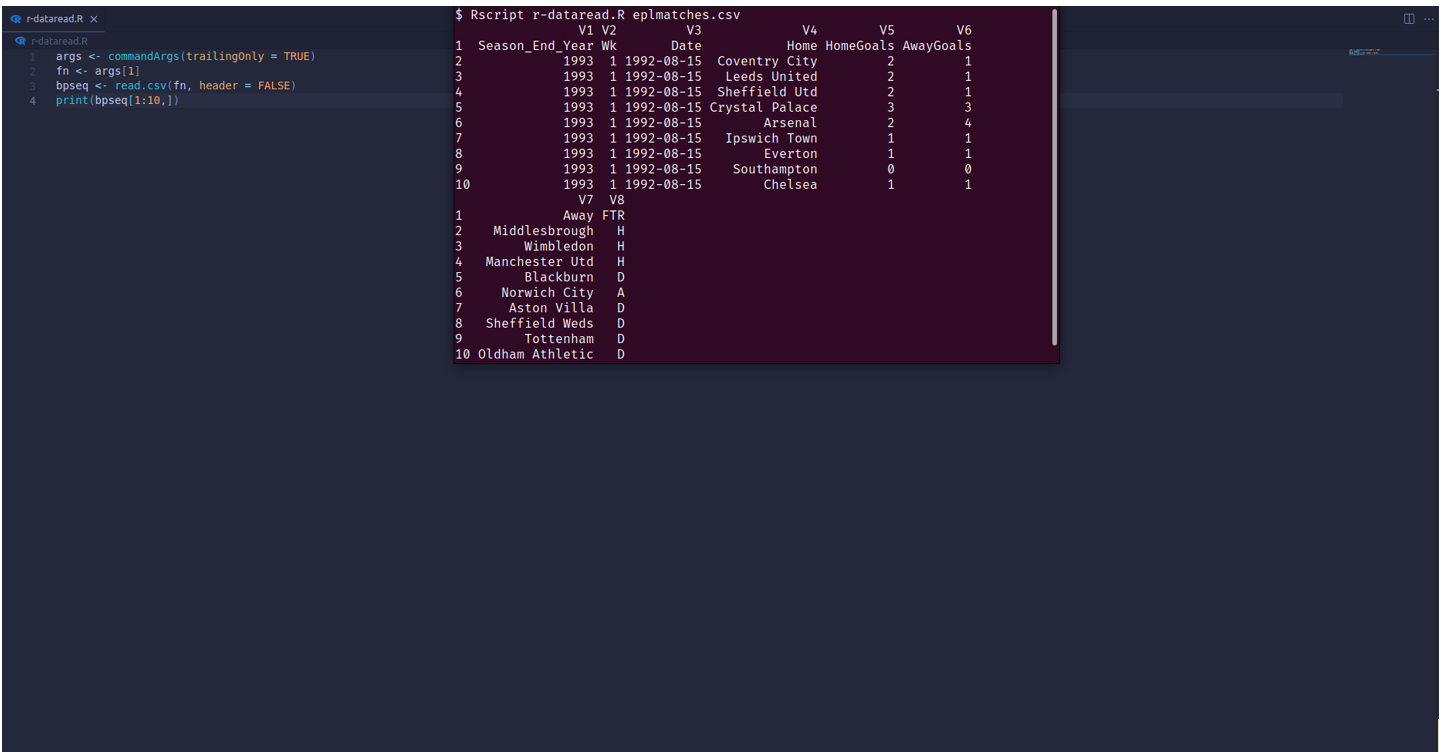
This data can now be manipulated and used to predict how specific teams would perform on their Home fields against some specific teams using the built-in statistical models in R.
Python
Python is another open-source programming language that is used for data analysis. It provides some of the best support in available frameworks, allowing its users to carry out data manipulation tasks relatively quickly. It is one of data science’s most widely used programming languages today. Python is considered one of the most powerful tools with software libraries like NumPy, Pandas, and Seaborn. These libraries can help visualize complex datasets but also help generate exploratory data analysis reports that enable users to understand better the data they are dealing with.
Most data analysis tasks are done using the Pandas library in Python. Pandas allow you to access your tabular data as a DataFrame. DataFrames are two-dimensional data structures that display data in the form of a table which makes data manipulation easy to understand and implement. An example of Pandas DataFrame containing English Premier League Matches (1992-2022) data is shown below:
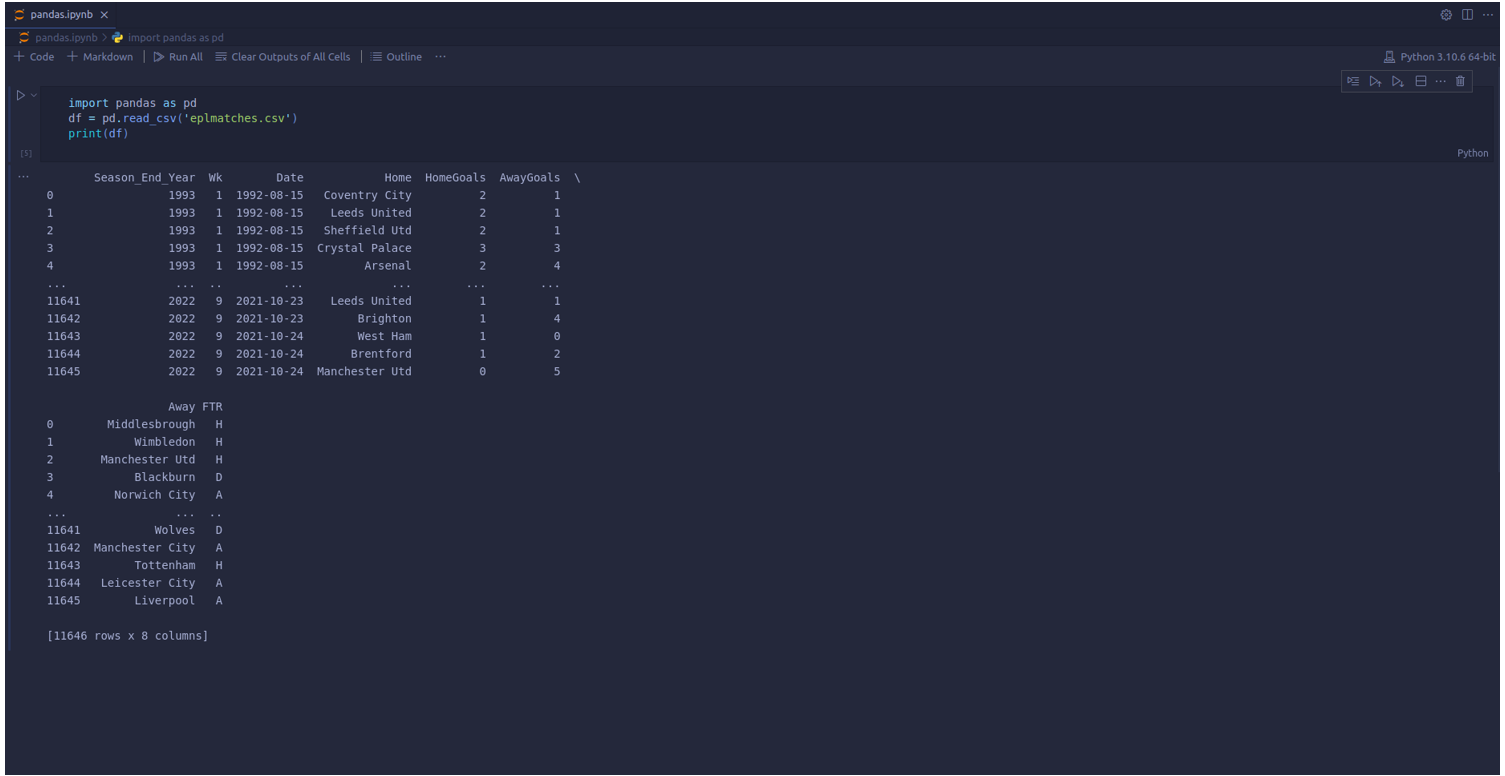
Now that we have this data in a specific data structure, we can manipulate it in any way we require. The possibilities are endless, from certain records from the entire dataset, running different statistical and predictive models, and augmenting this data using augmentation techniques that help enhance the data to our specific needs.
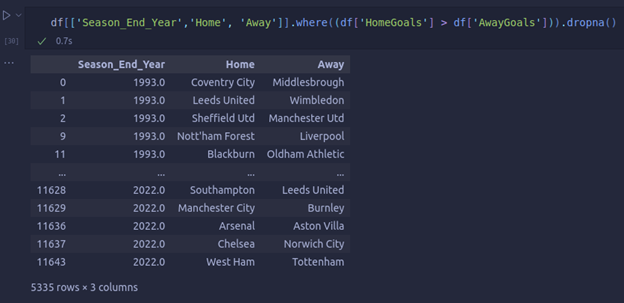
In this same data, if we were to look for all the teams who won the matches on their Home fields, it would look something like this:
These tools make Python a very widely used programming language. The complexity of the task at hand does not play a huge role in considering this language as your language of choice for data analytics since, no matter the task, Python allows you to compute your results with a few lines of code easily.
SQL
SQL is a query language that deals with data placement and retrieving into and from a database. This comes in handy when tasks require constant reading and writing of data for different data analysis techniques. It is a fact that databases provide some of the safest and considerably quick ways to access data on the fly, which is why SQL databases are used for some data analytics use cases.
Although SQL is not as powerful as the other languages mentioned here, it does, however, provide some very unique ways of accessing huge amounts of data that other languages do not offer. Most things that can be done in SQL can also be done in R and Python. What helps SQL stand apart is that it enables you to understand how a machine stores and retrieves data. This allows you to learn and implement data-related tasks in a more visual understanding manner. This, as a result, trains your brain to better understand how complex data flow works.
Comparison
All of the tools mentioned in this article are used for specific cases when it comes to data analytics.
What helps R stand apart from Python and SQL is the way it solves data analysis tasks. Since R is a tool that uses a statistics-first approach to data analytics, its use cases differ from those of Python and SQL. When it comes to solving problems that require deep statistical analyses, R is the better tool. R also comes in handy when being used by people who have little or no programming knowledge, to begin with. This is why R is widely used in academia and research by people who usually do not have the significant programming expertise required to accomplish the same task in Python and SQL.
If you are well-versed in programming, Python is a powerful tool that can give you an edge over R and SQL. Since Python supports way more data formats, including JSON (sourced from the web) and even SQL tables, it enables you to work with more data types, resulting in a more enhanced data analytics experience. Compared to Python, R can only be used with data in CSV (comma-separated values), excel, or text file format. This limitation provides Python developers with an upper hand in data analytics.
Moreover, the frameworks available for Python enable users to create and run deep neural networks for better insight generation on any data. There are many instances when deep neural networks outshine deep statistical models, which is why Python outshines the competition in such cases.
SQL provides a distinct advantage over both Python and R regarding data manipulation over large data sets. SQL has no such limitation where there are record limits in Python and R, caused by the Excel and CSV format limitations. A small SQL database running on an average machine will be able to perform calculations on large data sets more efficiently than Excel or CSV in Python and R. However, both of these platforms overtake SQL’s inability to perform certain complex tasks like deep statistical analyses or running deep neural networks for inference extrapolation on data sets.
Conclusion
All the programming languages mentioned in this article have some role in data analytics. SQL enables you to improve your workflow by making the reading and writing of data easy and visually better to use. Some languages, like R, are easy to learn even for beginners, and their implementation is also considerably easy. They are powerful in data-driven tasks and perform most tasks efficiently. Some allow for a more comprehensive work environment and enable the user to run complex neural network models like in Python, making data analysis easy.
It all boils down to the use case and personal preference when selecting a programming language for data analytics. Most data science professionals would suggest using Python since it provides the most well-rounded support for all kinds of workflows but using R or SQL would not slow you down either way. It is important to keep in mind that learning multiple tools for different use cases or using a hybrid workflow that utilizes more than one tool for solving problems requiring complex solutions is not new in the data analytics domain.