KmPlot is a KDE suite program that is used to plot a graph of a function and its integrals or derivatives. It is a fantastic mathematical plotter. KDE is capable of plotting different functions simultaneously and combining them in a new function. All of these graphs can be colorized, and views are scalable, zoomable, and configurable. KmPlot program offers a fantastic mathematical parser and multiple plot types such as polar, implicit, differential, parametric, etc.
It provides simple mathematical tools for finding the maximum/minimum of a function. All parametrized functions can be viewed by adjusting variable parameters through a slider. These plots can be exported as a BMP and PNG, and users can print them. So here is a list of features offered by KmPlot:
- It offers visual and numerical features.
- You can find maxima and minima.
- You can dynamically change the function parameters.
- It helps to plot Integra and derivative functions.
- You can plot between a plot and the first axis of graphs.
It is good to go for the KmPlot program if you want to plot different functions and measure them to understand their behavior. This article will explain the entire procedure of plotting on Linux with KmPlot, including installation.
Plotting on Linux with KmPlot
As KmPlot is a part of the KDE project, it is available in most package management systems. We are using a Debian-based system to execute the below command for installing KmPlot in the system.
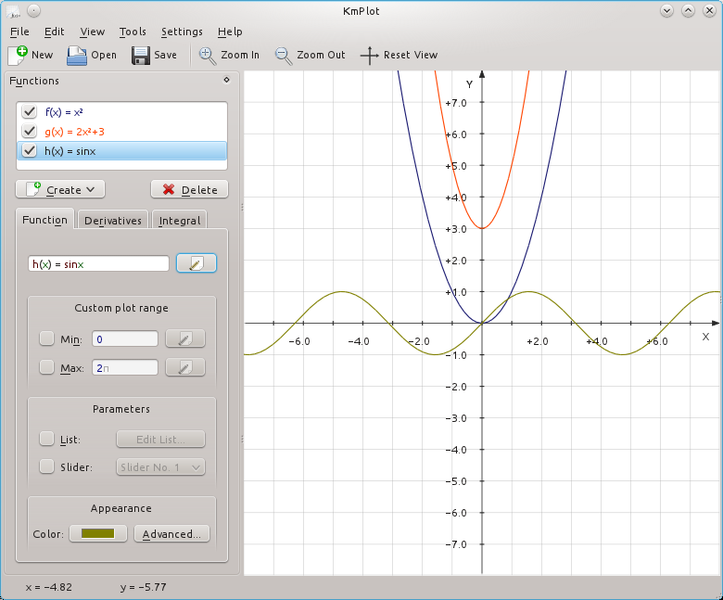
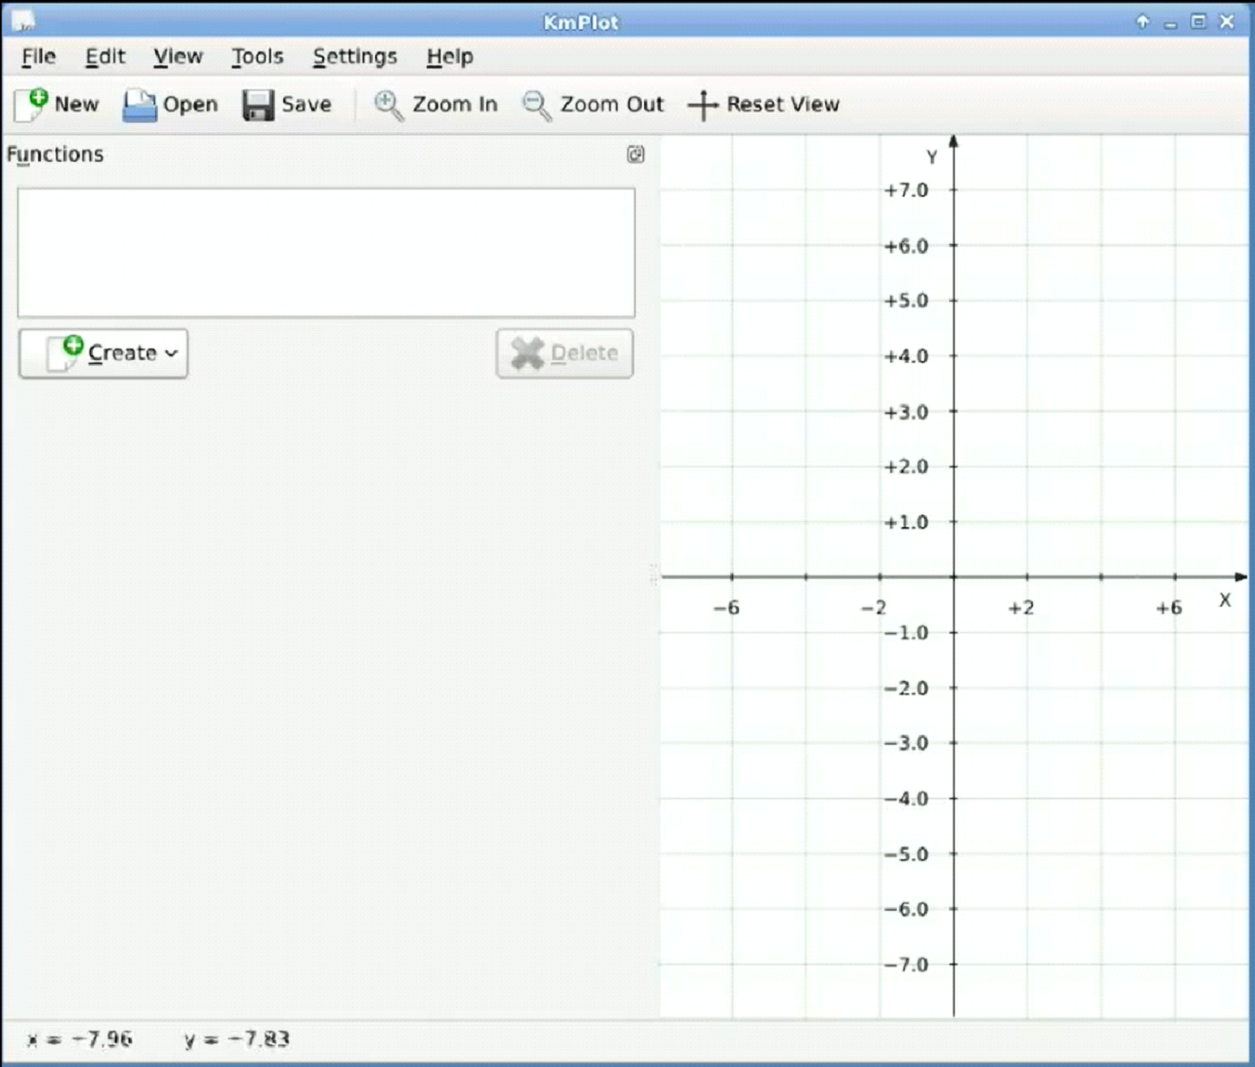
After opening the KmPlot, you will get a blank space for starting mathematical functions in it. There is a function list window on the left side of the screen in which you can select the functions to work on your project. There is a main plotting window at the right side representing all of the changes occurring in a graphical display.
Now, create functions for using them in KmPlot, so click on the Create button to open a new menu. In this option, you can select different plots like Cartesian, differential, or polar.
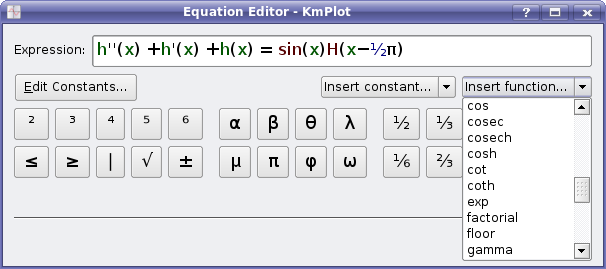
There are simple functions and predefined constants for creating specific functions in the KmPlot. After finishing it, KmPlot will update your main window by generating plots on the graph. You can also go for the advanced options by clicking on the Advanced button. Now you can change the default options for your work.
After that, set the labels for a function’s name, maxima, and minima. Go on the lower left-hand pane to see the integrals and derivatives of selected functions. Now, click on the color button and select colors for the derivative curve for highlighting a new plot.
You can also create complicated plots using the combinations of functions in work. This option is advantageous when you want to get in-depth details of the underlying behavior of functions. KmPlot also offers some options to work with plots, so click on the Plot Area tools for opening a pop-up window. You can select Cartesian plots for calculating the area between the x-axis and curve. You can click on the Tools, then calculator option, to open a new window for calculations/quick calculations.
Two options in the Tools menu are used for finding local minima and maxima. Hence, you have to provide an appropriate range to search so that KmPlot can constrain the search. The coordinate system is the essential aspect of plotting a function in KmPlot. You can also tailor the coordinate system from a specific option, so click on the View and select Coordinate System for it.
If you want to change axes x and y limits by setting up axis grid spacing, you can define the tools options’ grid spacing functions. As we have described above, KmPlot is a part of the KDE suite, obtaining multiple parts of the project’s capabilities. You can easily script the KmPlot’s behavior using D-Bus commands. For instance, you can plot a function using the following command:
↪org.kde.kmplot.Parser.addFunction "f(x)=4sinx+2cosx" ""
After completing your work on KmPlot, you can save it by clicking on the File, then Save or Fake and Save. As for saving the work in any format, you can also save your work as an image by clicking on Click File and then Export to save a plot window into image formats.
Conclusion
KmPlot is a part of a KDE suite program that is used for the graph functions. It is a tremendous mathematical plotter KDE and can plot different functions simultaneously and combine them in a new function. In this article, we have included all of the required details regarding plotting on Linux with KmPlot so that you can use it on your system easily. We have covered the complete procedure from installation to saving a final file in your system.


