Lollipop Chart
A lollipop chart is used to summarize a set of categorical data. It is a similar kind of Barplot but instead of bars, it takes a line and a circle on top of each line.
- In the horizontal lollipop chart, the x-axis holds the discrete values and the y-axis holds the categorical data.
- In the vertical lollipop chart, the x-axis holds the categorical data and the y-axis holds the discrete values.
1. Building a Basic Lollipop Chart (Vertical)
Let’s build a basic lollipop chart by following the given steps. Each step syntax is provided with an example. Mostly, each step includes selecting SVG, passing the attributes to the functions that we use at each step.
Place this script inside your head tag in the HTML template.
Step 1: Set the Margins and Dimensions for the Lollipop Chart
The first step is to set up the margins and dimensions to the lollipop chart which is going to be created.
- Create a variable of dictionary type that holds four entries. Let them be
{top: value, right: value, bottom: value, left: value}. - Create the width and height using the previous keys from the dictionary.
- width = value – dictionary.left – dictionary.right,
- height = value – dictionary.top – dictionary.bottom;
Step 2: Define the Data
Next, we have to declare the data for the lollipop chart. Basically for a lollipop chart, we can pass the data from the CSV for an array of dictionaries.
Step 3: Setup the Scales (xScale & yScale)
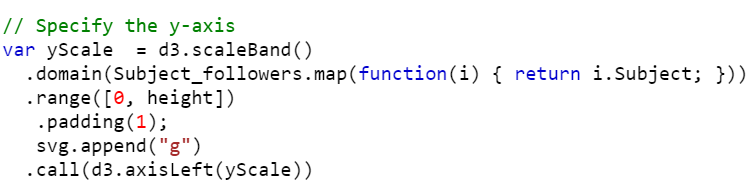
Use the scaleBand() function to construct a band scale for the x-axis.
- It takes the input_data as a domain. We can use the “map” function to choose a specific key for the x-axis.
- The range is the output. Make sure that it should be the width of the svgContainer.
- Padding can be provided in between two lollipops by passing the padding property.
- Call the axisBottom() function to place the axis bottom of the line. It takes the “x” point as a parameter.
- Here, we place the categorical elements. To display them, specify the text using the selectAll(“text”) function.
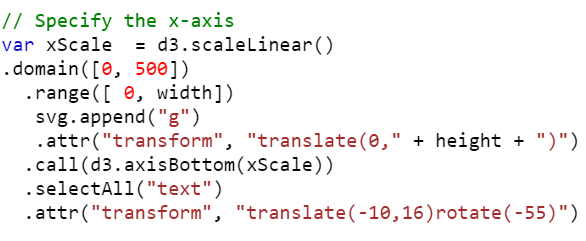
Use the scaleLinear() function to represent the discrete numeric data.
- The height must be equal to the svgContainer. Pass the height to the range().
- Call the axisLeft() function to place the axis on the left of the line. It takes the “y” point as a parameter.
Step 4: Add the Lines and Circles
The final and most important step is to add the lines and circles to the axes.
Lines:
- Get the data using the data() function.
- Append the line to the SVG.
- Designate the position of two points on a web page:
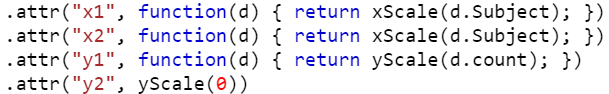
- x1 – The position of the first end of the line.
.attr(“x1”, function(d) { return xScale(d.Category); }) - x2 – The position of the second end of the line.
.attr(“x1”, function(d) { return xScale(d.Category); }) - y1 – The position of the first end of the line.
.attr(“y1”, function(d) { return yScale(d.Numeric); }) - y2 – The position of the second end of the line attributes are used.
.attr(“y2”, yScale(0))
- x1 – The position of the first end of the line.
Circles:
- Get the data using the data() function.
- Append the circle to the SVG.
- Circle Positions:
- cx – The position of the circle that takes the “x” position refers to the categorical element.
- cy – The position of the circle that takes the “y” position refers to the numeric element.
- r – It specifies the circle radius.
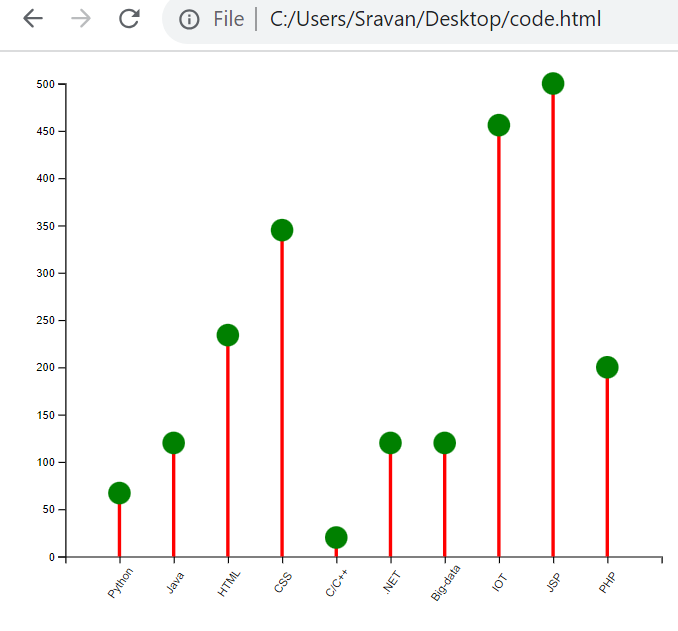
Example:
Create a lollipop chart related to the subject followers. The Subject_followers data (array of 10 dictionaries) that we are considering holds two keys in each dictionary – subject and count.
The points are:
<head>
<script src="https://d3js.org/d3.v4.js"></script>
</head>
<body>
<div id="place"></div>
<script>
// Set the Margins and Dimensions for the Lollipop Chart.
var margin_for_the_lollipop = {top: 20, right: 20, bottom: 60, left: 50},
width = 600 - margin_for_the_lollipop.left - margin_for_the_lollipop.right,
height = 500 - margin_for_the_lollipop.top - margin_for_the_lollipop.bottom;
var svg = d3.select("#place")
.append("svg")
.attr("width", width + margin_for_the_lollipop.left + margin_for_the_lollipop.right)
.attr("height", height + margin_for_the_lollipop.top + margin_for_the_lollipop.bottom)
.append("g")
.attr("transform","translate(" + margin_for_the_lollipop.left + "," + margin_for_the_lollipop.top + ")");
// Input Data - Subject_followers
Subject_followers = [
{Subject : "Python",count: 67},
{Subject: "Java",count: 120},
{Subject: "HTML",count: 234},
{Subject: "CSS",count: 345},
{Subject: "C/C++",count: 20},
{Subject : ".NET",count: 120},
{Subject: "Big-data",count: 120},
{Subject: "IOT",count: 456},
{Subject: "JSP",count: 500},
{Subject: "PHP",count: 200}
]
// Specify the x-axis
var xScale = d3.scaleBand()
.range([ 0, width])
.domain(Subject_followers.map(function(i) { return i.Subject; }))
.padding(1);
svg.append("g")
.call(d3.axisBottom(xScale))
.attr("transform", "translate(0," + height + ")")
.selectAll("text")
.attr("transform", "translate(-10,16)rotate(-55)")
// Specify the y-axis
var yScale = d3.scaleLinear()
.domain([0, 500])
.range([ height, 0]);
svg.append("g")
.call(d3.axisLeft(yScale));
// Add Lines
svg.selectAll("Anything")
.data(Subject_followers)
.enter()
.append("line")
.attr("x1", function(d) { return xScale(d.Subject); })
.attr("x2", function(d) { return xScale(d.Subject); })
.attr("y1", function(d) { return yScale(d.count); })
.attr("y2", yScale(0))
.attr("stroke", "red")
.attr("stroke-width", 3)
svg.selectAll("Circle")
.data(Subject_followers)
.enter()
// Append the Circle by specifying the cx and cy points with radius (r) = 10
.append("circle")
.attr("cx", function(d) { return xScale(d.Subject); })
.attr("cy", function(d) { return yScale(d.count); })
.attr("r", "10")
// Also use the style attribute to fill these circles with green color
.style("fill", "green")
</script>
</body>
</html>
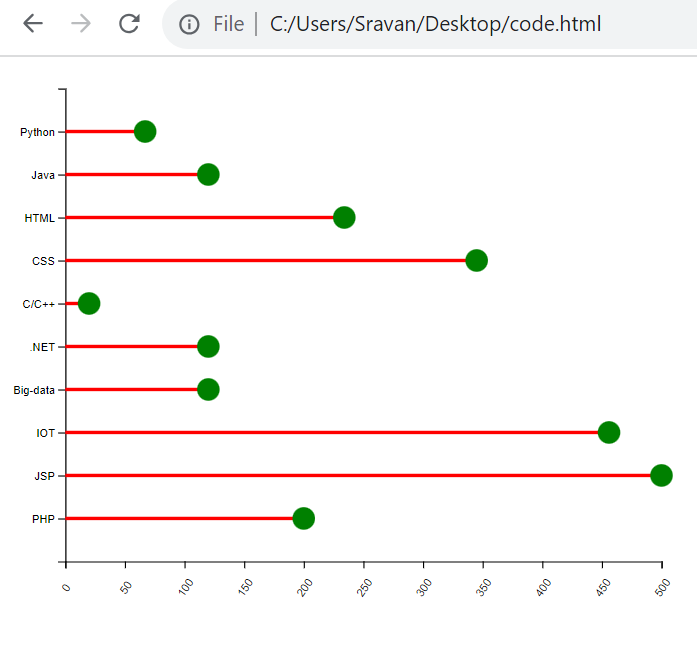
Output:
2. Building the Basic Lollipop Chart (Horizontal)
We can follow the same steps to build the horizontal lollipop chart but the functions and attributes vary in the scales.
1. xScale
The xScale takes the scaleLinear() function and the domain holds the discrete data.
Example:
2. yScale
The yScale takes the scaleband() function and the categorical data is passed to the domain(). Also, the range() takes (0, height) instead of (height, 0).
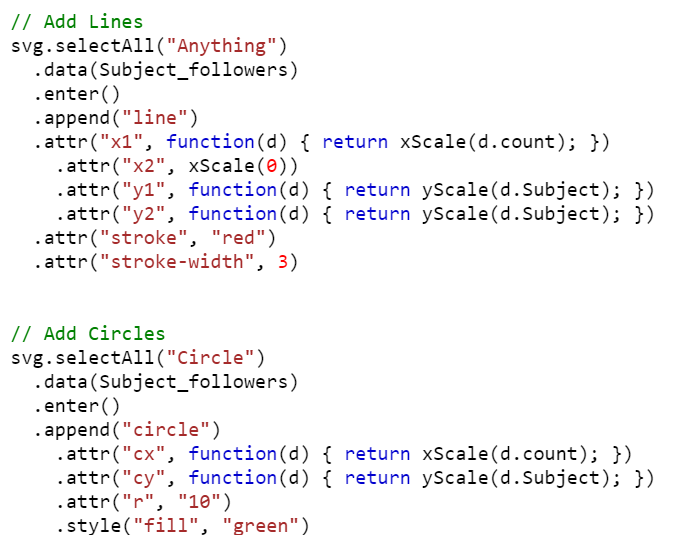
3. Adding Lines and Circles
Go through the changes in the following snippet:
Example:
Use the same data and generate a horizontal lollipop chart.
<head>
<script src="https://d3js.org/d3.v4.js"></script>
</head>
<body>
<div id="place"></div>
<script>
// Set the Margins and Dimensions for the Lollipop Chart.
var margin_for_the_lollipop_chart = {top: 20, right: 20, bottom: 60, left: 50},
width = 600 - margin_for_the_lollipop_chart.left - margin_for_the_lollipop_chart.right,
height = 500 - margin_for_the_lollipop_chart.top - margin_for_the_lollipop_chart.bottom;
var svg = d3.select("#place")
.append("svg")
.attr("width", width + margin_for_the_lollipop_chart.left + margin_for_the_lollipop_chart.right)
.attr("height", height + margin_for_the_lollipop_chart.top + margin_for_the_lollipop_chart.bottom)
.append("g")
.attr("transform","translate(" + margin_for_the_lollipop_chart.left + "," + margin_for_the_lollipop_chart.top + ")");
// Input Data - Subject_followers
Subject_followers = [
{Subject : "Python",count: 67},
{Subject: "Java",count: 120},
{Subject: "HTML",count: 234},
{Subject: "CSS",count: 345},
{Subject: "C/C++",count: 20},
{Subject : ".NET",count: 120},
{Subject: "Big-data",count: 120},
{Subject: "IOT",count: 456},
{Subject: "JSP",count: 500},
{Subject: "PHP",count: 200}
]
// Specify the x-axis
var xScale = d3.scaleLinear()
.domain([0, 500])
.range([ 0, width])
svg.append("g")
.attr("transform", "translate(0," + height + ")")
.call(d3.axisBottom(xScale))
.selectAll("text")
.attr("transform", "translate(-10,16)rotate(-55)")
// Specify the y-axis
var yScale = d3.scaleBand()
.domain(Subject_followers.map(function(i) { return i.Subject; }))
.range([0, height])
.padding(1);
svg.append("g")
.call(d3.axisLeft(yScale))
// Add Lines
svg.selectAll("Anything")
.data(Subject_followers)
.enter()
.append("line")
.attr("x1", function(d) { return xScale(d.count); })
.attr("x2", xScale(0))
.attr("y1", function(d) { return yScale(d.Subject); })
.attr("y2", function(d) { return yScale(d.Subject); })
.attr("stroke", "red")
.attr("stroke-width", 3)
svg.selectAll("Circle")
.data(Subject_followers)
.enter()
// Append the Circle by specifying the cx and cy points with radius (r) = 10
.append("circle")
.attr("cx", function(d) { return xScale(d.count); })
.attr("cy", function(d) { return yScale(d.Subject); })
.attr("r", "10")
// Also use the style attribute to fill these circles with green color
.style("fill", "green")
</script>
</body>
</html>
Output:
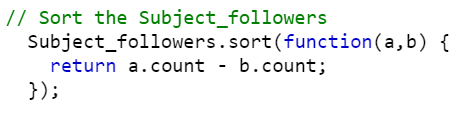
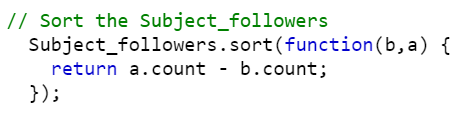
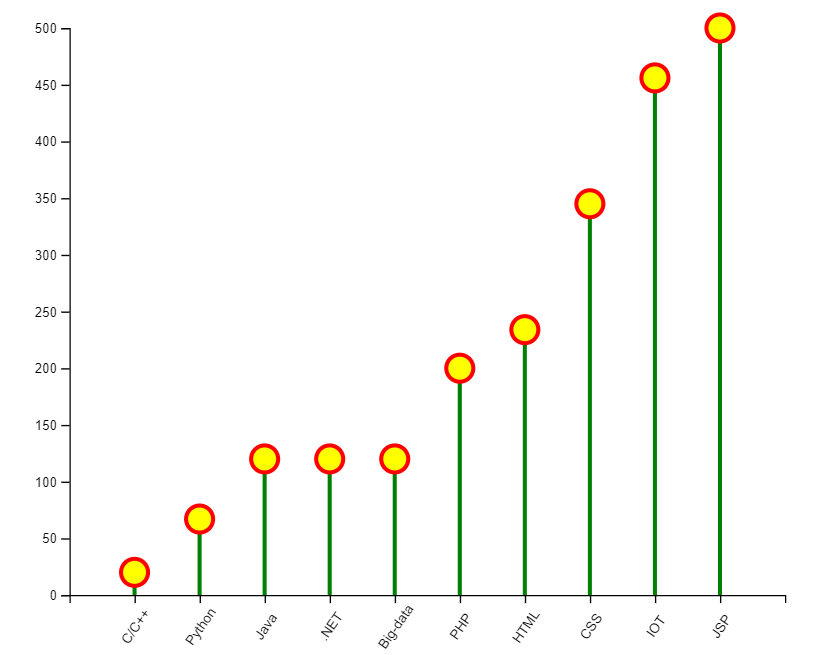
3. Building a Lollipop Chart by Ordering Groups
If you want to order the groups in lollipop chart, use the sort() function. Look at the following snippets that sorts the groups in ascending and descending order such that the lollipops in the graph are displayed based on the sorted order. Pass the function with two parameters to the sort() function. It returns the data in the ascending order by comparing two values at a time.
Ascending Order:
Descending Order:
Example:
Use the same script that is created in Example 1. Order the data based on the count key in ascending order.
<head>
<script src="https://d3js.org/d3.v4.js"></script>
</head>
<body>
<div id="place"></div>
<script>
// Set the Margins and Dimensions for the Lollipop Chart.
var margin_for_the_lollipop_chart = {top: 20, right: 20, bottom: 60, left: 50},
width = 600 - margin_for_the_lollipop_chart.left - margin_for_the_lollipop_chart.right,
height = 500 - margin_for_the_lollipop_chart.top - margin_for_the_lollipop_chart.bottom;
var svg = d3.select("#place")
.append("svg")
.attr("width", width + margin_for_the_lollipop_chart.left + margin_for_the_lollipop_chart.right)
.attr("height", height + margin_for_the_lollipop_chart.top + margin_for_the_lollipop_chart.bottom)
.append("g")
.attr("transform","translate(" + margin_for_the_lollipop_chart.left + "," + margin_for_the_lollipop_chart.top + ")");
// Input Data - Subject_followers
Subject_followers = [
{Subject : "Python",count: 67},
{Subject: "Java",count: 120},
{Subject: "HTML",count: 234},
{Subject: "CSS",count: 345},
{Subject: "C/C++",count: 20},
{Subject : ".NET",count: 120},
{Subject: "Big-data",count: 120},
{Subject: "IOT",count: 456},
{Subject: "JSP",count: 500},
{Subject: "PHP",count: 200}
]
// Sort the Subject_followers
Subject_followers.sort(function(a,b) {
return a.count - b.count;
});
// Specify the x-axis
var xScale = d3.scaleBand()
.range([ 0, width])
.domain(Subject_followers.map(function(i) { return i.Subject; }))
.padding(1);
svg.append("g")
.call(d3.axisBottom(xScale))
.attr("transform", "translate(0," + height + ")")
.selectAll("text")
.attr("transform", "translate(-10,16)rotate(-55)")
// Specify the y-axis
var yScale = d3.scaleLinear()
.domain([0, 500])
.range([ height, 0]);
svg.append("g")
.call(d3.axisLeft(yScale));
// Add Lines
svg.selectAll("Anything")
.data(Subject_followers)
.enter()
.append("line")
.attr("x1", function(d) { return xScale(d.Subject); })
.attr("x2", function(d) { return xScale(d.Subject); })
.attr("y1", function(d) { return yScale(d.count); })
.attr("y2", yScale(0))
.attr("stroke", "green")
.attr("stroke-width", 3)
svg.selectAll("Circle")
.data(Subject_followers)
.enter()
// Append the Circle by specifying the cx and cy points with radius (r) = 10
.append("circle")
.attr("cx", function(d) { return xScale(d.Subject); })
.attr("cy", function(d) { return yScale(d.count); })
.attr("r", "10")
// Also use the style attribute to fill these circles with "yellow" color
.style("fill", "yellow")
// Set stroke-width as 3 with color - "red".
.attr("stroke", "red")
.attr("stroke-width", 3)
</script>
</body>
</html>
Output:
Conclusion
First, we provided the steps for creating a basic lollipop chart in D3.js with proper functions and syntax. Then, we used the same data for plotting the horizontal lollipop chart. Use the d3.sort() function to sort the lollipops based on groups.