This article will show you how to monitor Raspberry Pi resources using Monitorix.
System Monitoring on Raspberry Pi Using Monitorix
You can install Monitorix on Raspberry Pi directly from the Raspberry Pi repository through the following command:
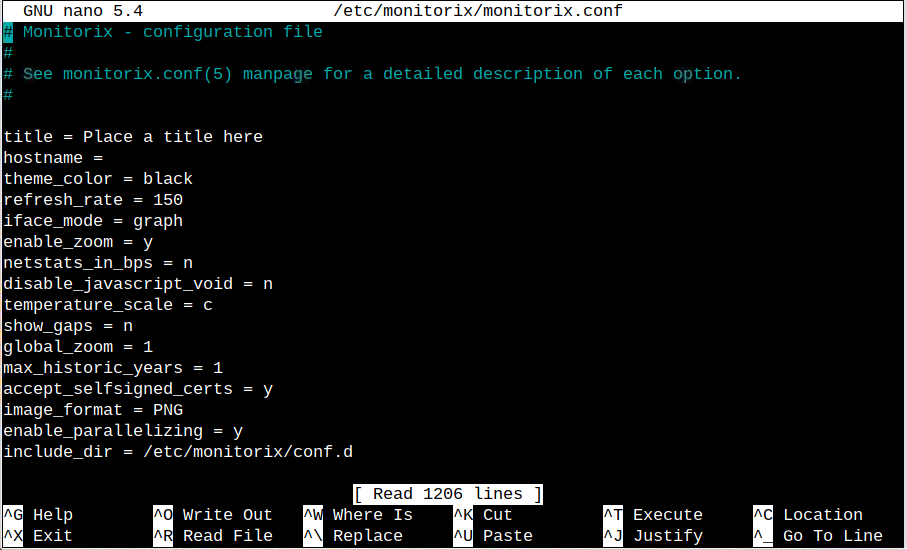
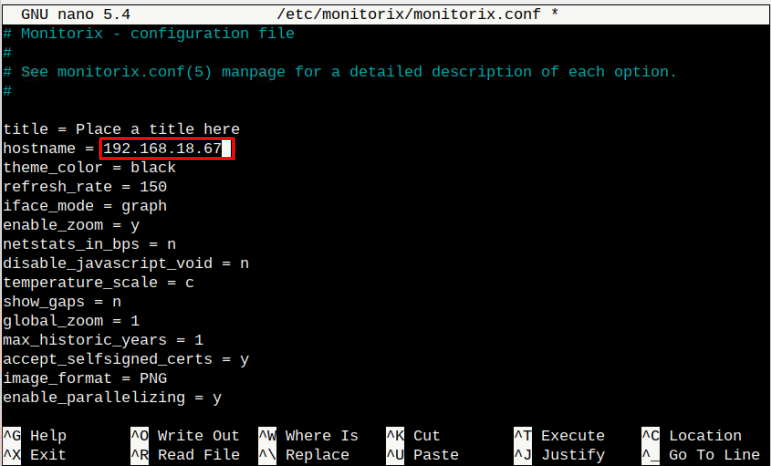
After the installation, you can open the configuration file and can fix the hostname for Monitorix, leaving the other settings by default. You can continue with the Monitorix default configuration if you don’t want to open the file.
Note: To find the host IP address for Raspberry Pi, you can use the “hostname -I” command.
After adding the IP address, you can save the file using “CTRL+X” and add “Y” to save the change and enter to exit the file.
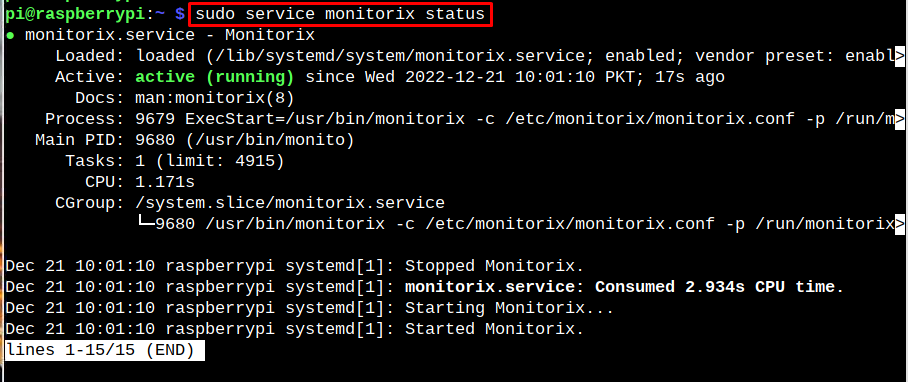
Once the changes are done, you have to restart Monitorix service using the following command:
To confirm the changes successfully applied, don’t forget to run the following command:
Access Monitorix Web Interface on Raspberry Pi
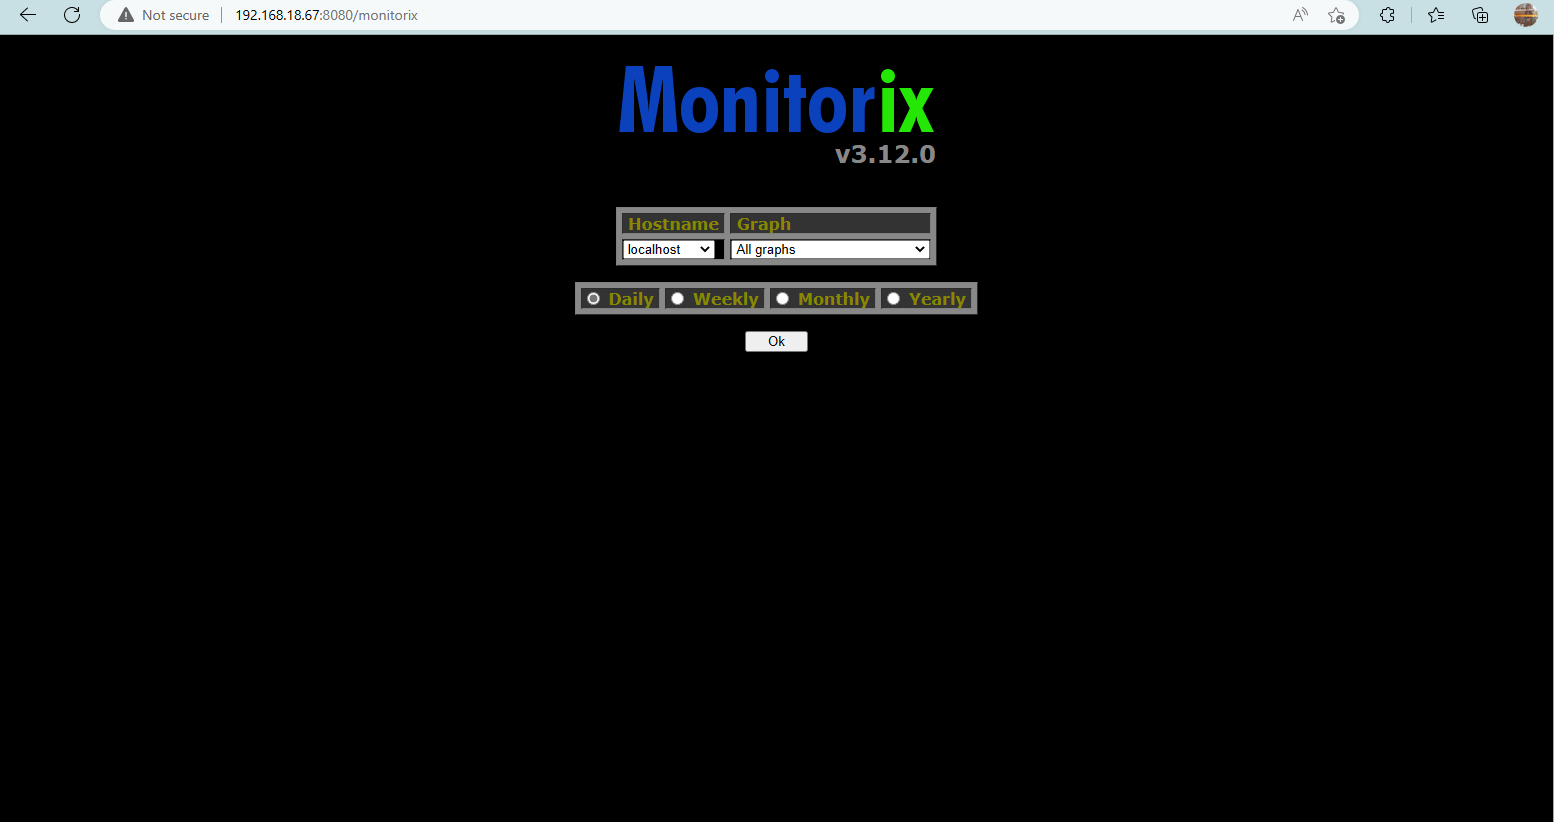
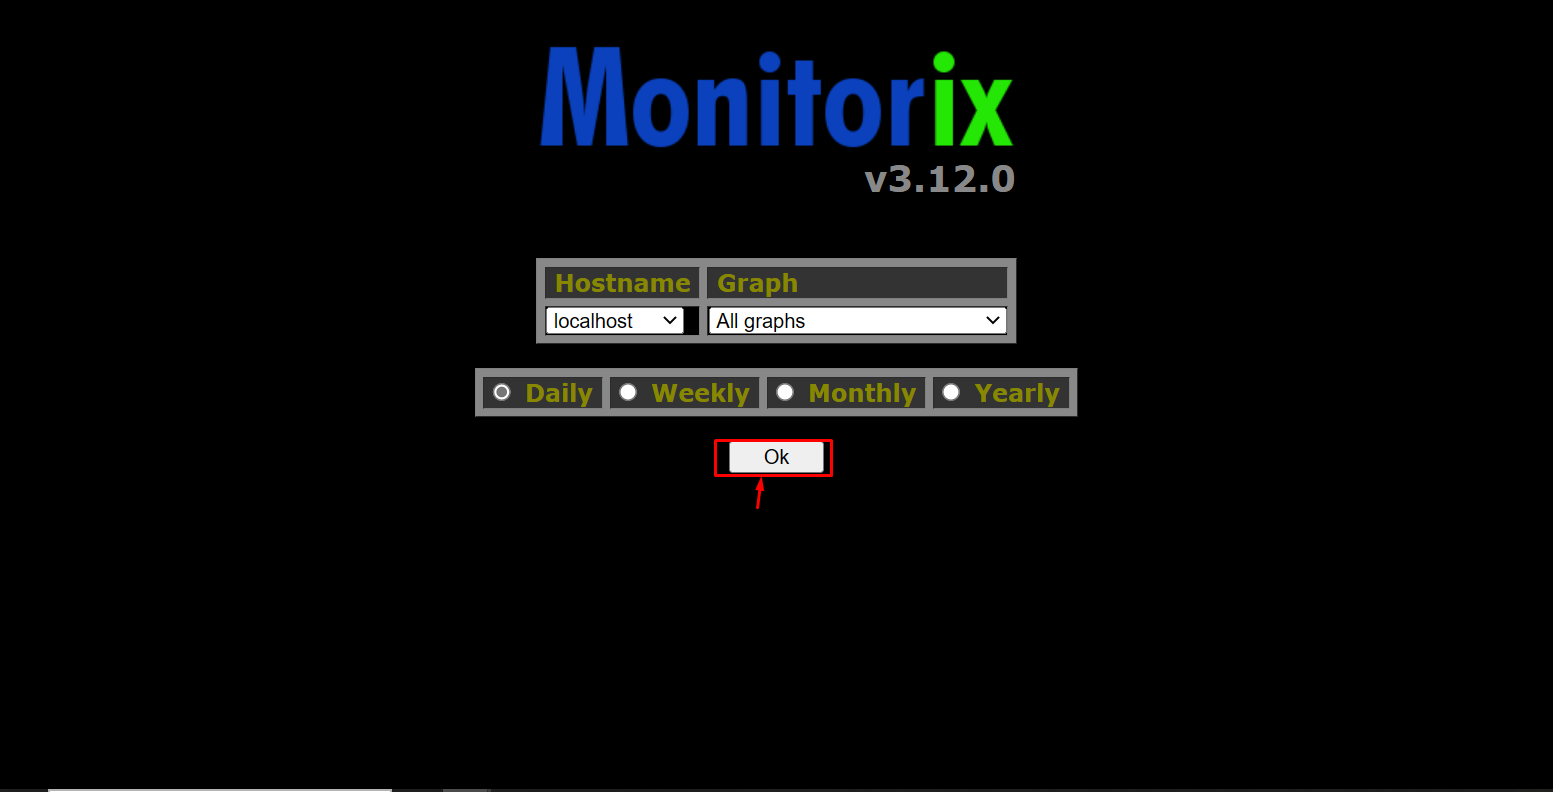
Now, go to any system browser and enter the IP address of Raspberry Pi using the default port “8080” for Monitorix to open the web interface.
It’s up to you whether you want to monitor Raspberry Pi daily, weekly, monthly, or yearly. In my case, I am going with the “Daily” option and press “Ok” to continue.
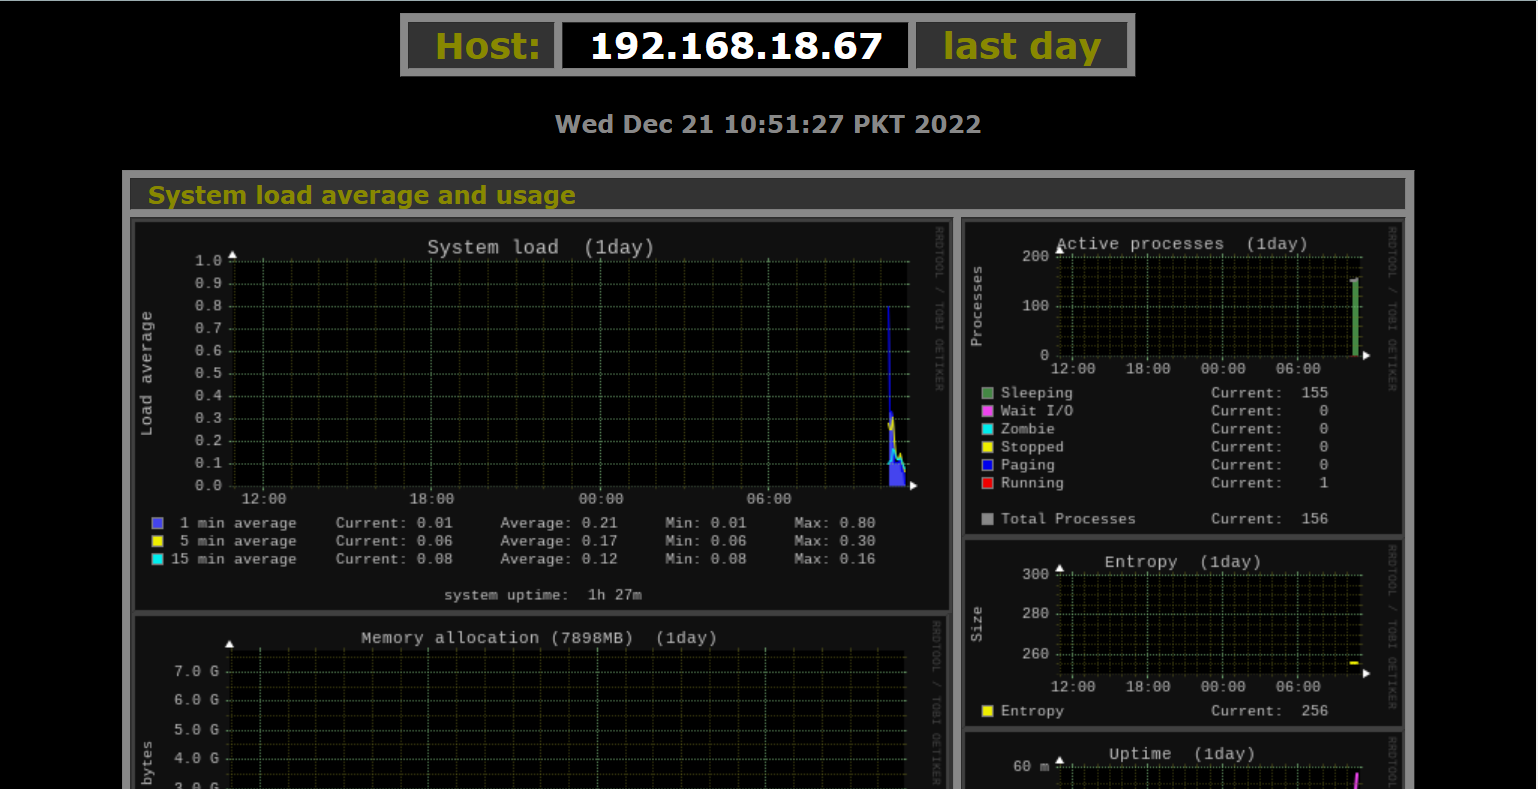
Wait for an hour or so to see some spikes on the graph because Monitorix won’t show you the result immediately.
You have to spend some time till the graph will start appearing on the Monitorix dashboard. At this point, you have successfully set up Monitorix on Raspberry Pi.
Conclusion
Monitorix is a tool for monitoring Raspberry Pi resources on the web interface. It can be installed directly on Raspberry Pi from the default repository. Once the installation is done, you can access the Monitorix web interface using the IP address of your Raspberry Pi device. However, to get the graphs, you have to spend some hours to see the spikes on the graph appear on the web interface.


