In this article, we will show you the complete step-by-step procedure to install and set up Checkmk on your Raspberry Pi system.
How to Monitor Raspberry Pi Linux Through Checkmk
Checkmk has an open-source edition that you can easily download from the GitHub website and to perform the whole process, follow the below-mentioned steps:
Step 1: Download Checkmk Debian File
First, download the Checkmk latest release Debian file from the GitHub source using the following command:
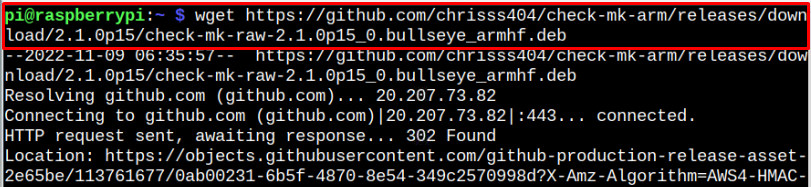
Make sure to check for the latest Checkmk release here and then download your version accordingly.
Note: The above command is executed on 32Bit Raspberry Pi OS.
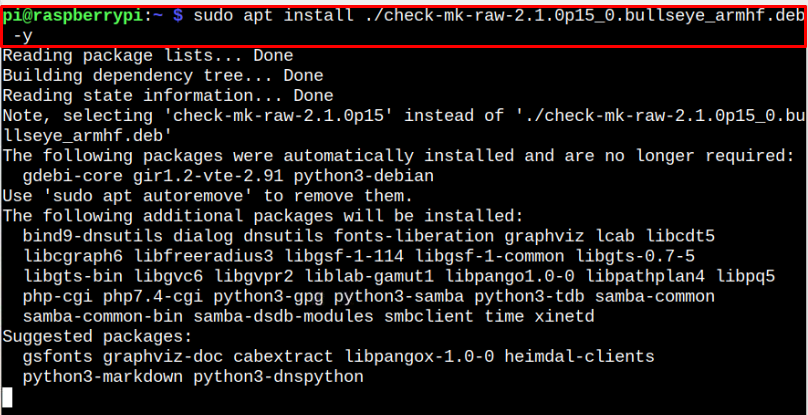
Step 2: Install Checkmk Debian Package
Now, to install the Checkmk Debian package, make sure the package you download is in the home directory to successfully apply the following command for installing Checkmk .deb package or provide the complete path.
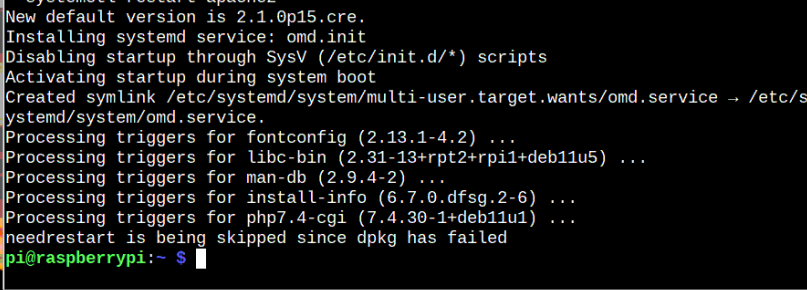
Incase if you experience a similar error like the one shown below:
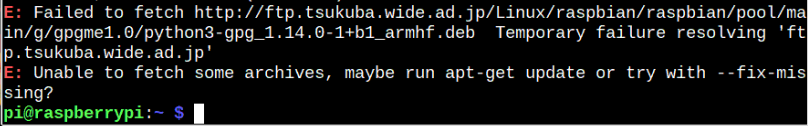
Fix it by running the following command:
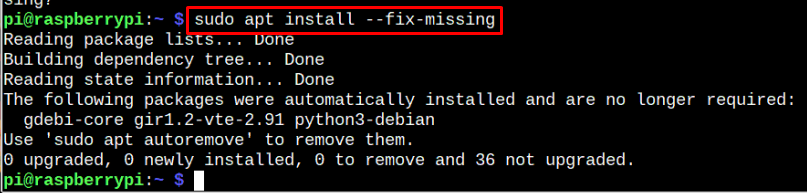
After running the above command, you must execute the apt installation command again to install Checkmk on the Raspberry Pi system successfully.
Step 4: Confirm Checkmk Installation
To confirm the Checkmk installation, you can use the following version command:

Step 5: Start Checkmk on Raspberry Pi
To start Checkmk on Raspberry Pi, follow the below-given “omd” command:
Step 6: Create a Monitoring Site
Now on Checkmk, you have to create a site where all your system information can be monitored. You can create a site easily through the following command:
Let’s replace <site_name> with linux_site:
You can use any site name you want.
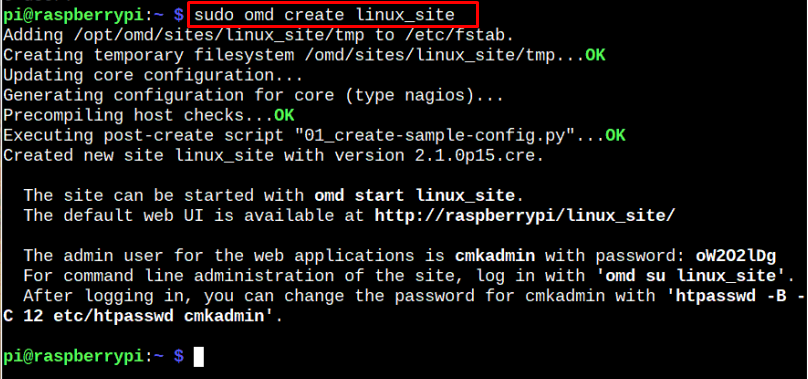
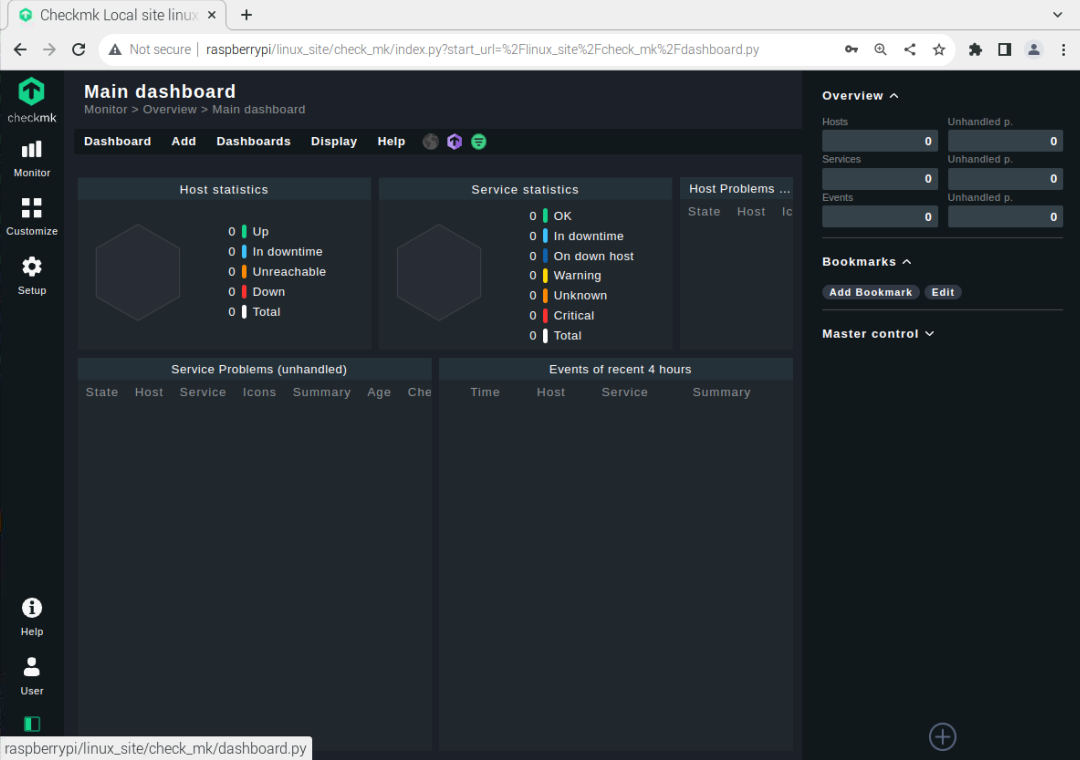
The above command generates a site with the login information. You can access this site on your Raspberry Pi browser by first starting the site through the following command:
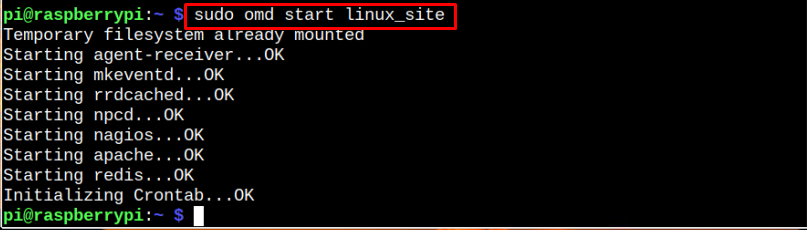
Then go to the Raspberry Pi browser and enter the address http://hostname/<site_name>.
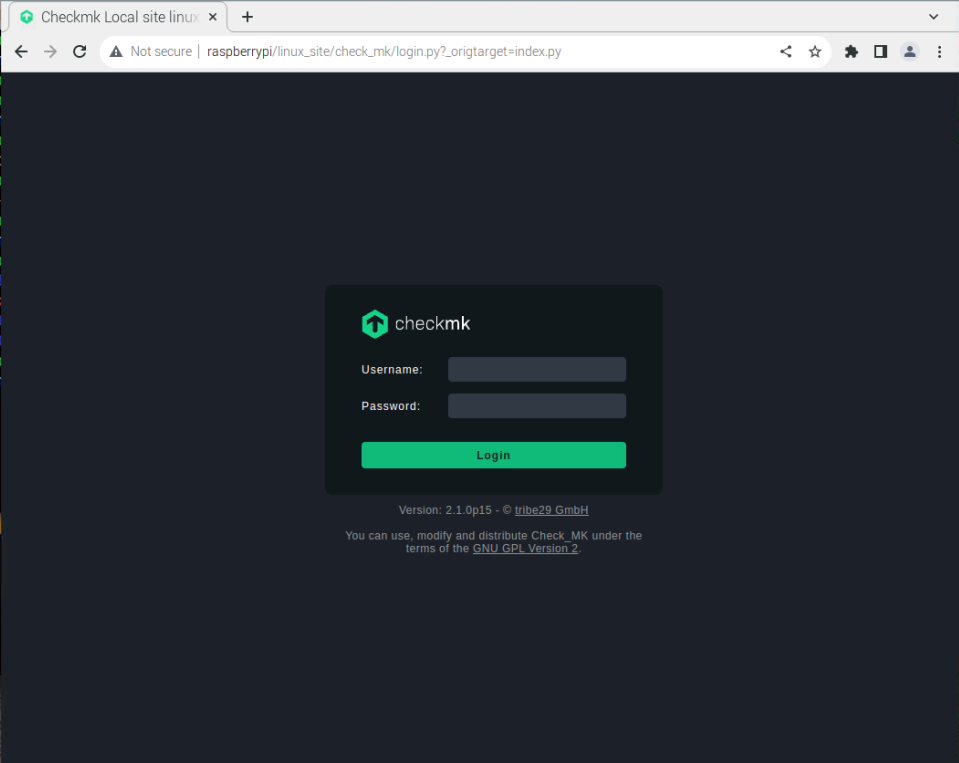
Login with the credentials you were assigned once you create the site.
Step 7: Installing an Agent on Monitoring Server
To start monitoring on the Raspberry Pi system, you must install an Agent, which can help you by providing you with several useful information about Raspberry Pi. There are different agents you can install, but here I will show you the procedure to install the agent on Raspberry Pi.
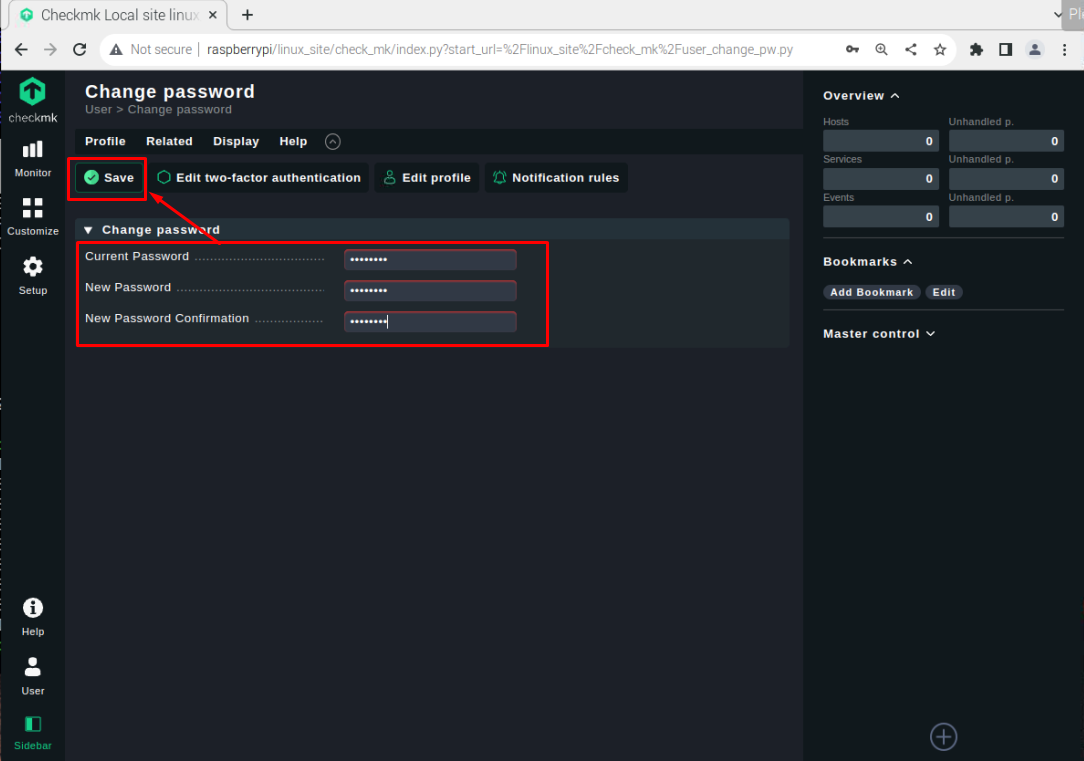
However, before doing this process, you must change your password from the “User” section.
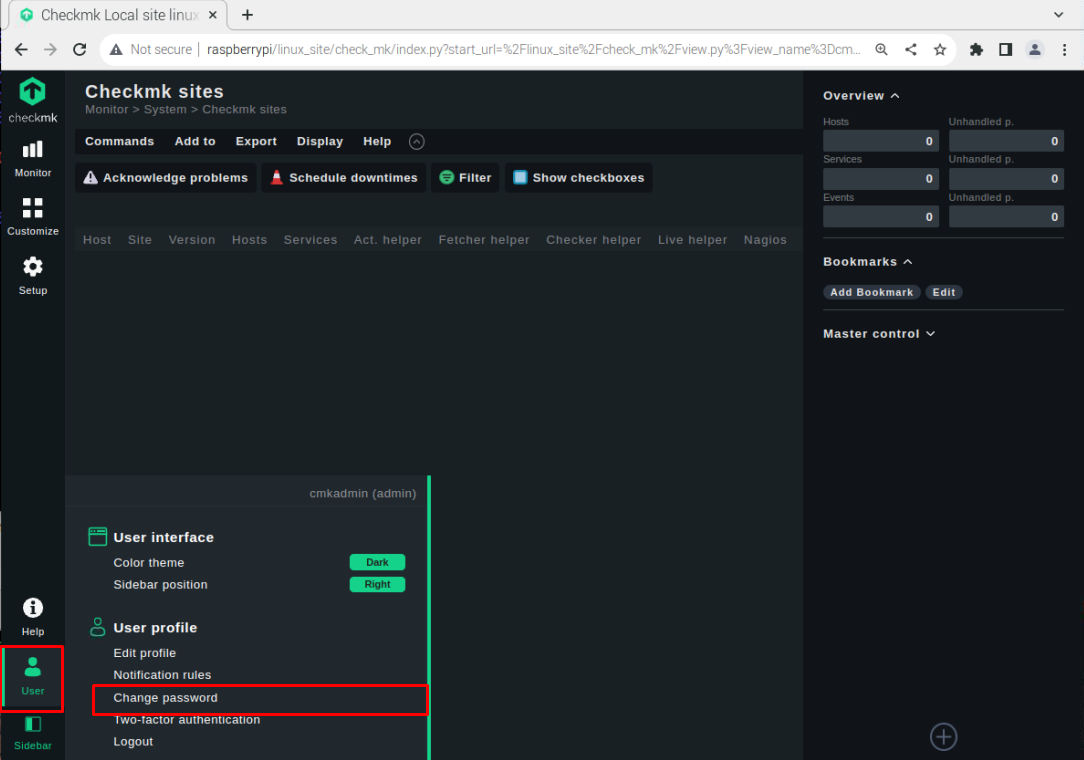
Set a strong password.
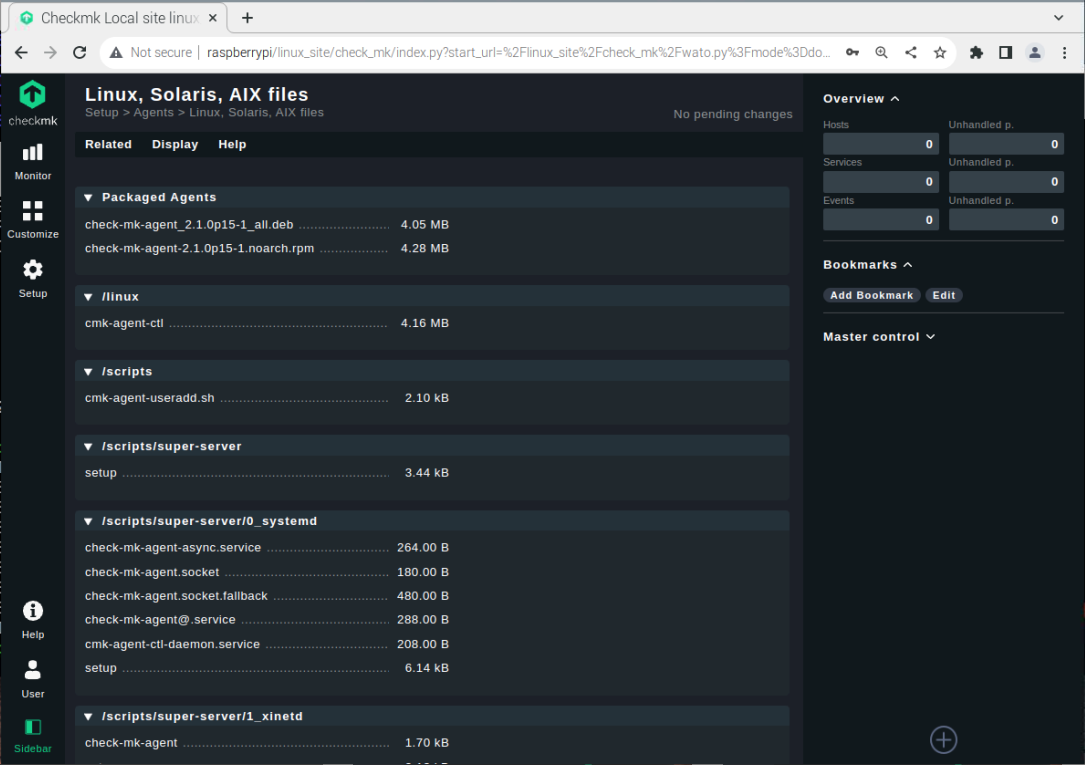
Now go to the “Setup” section and choose the “Linux” option since we are using the Raspberry Pi system.
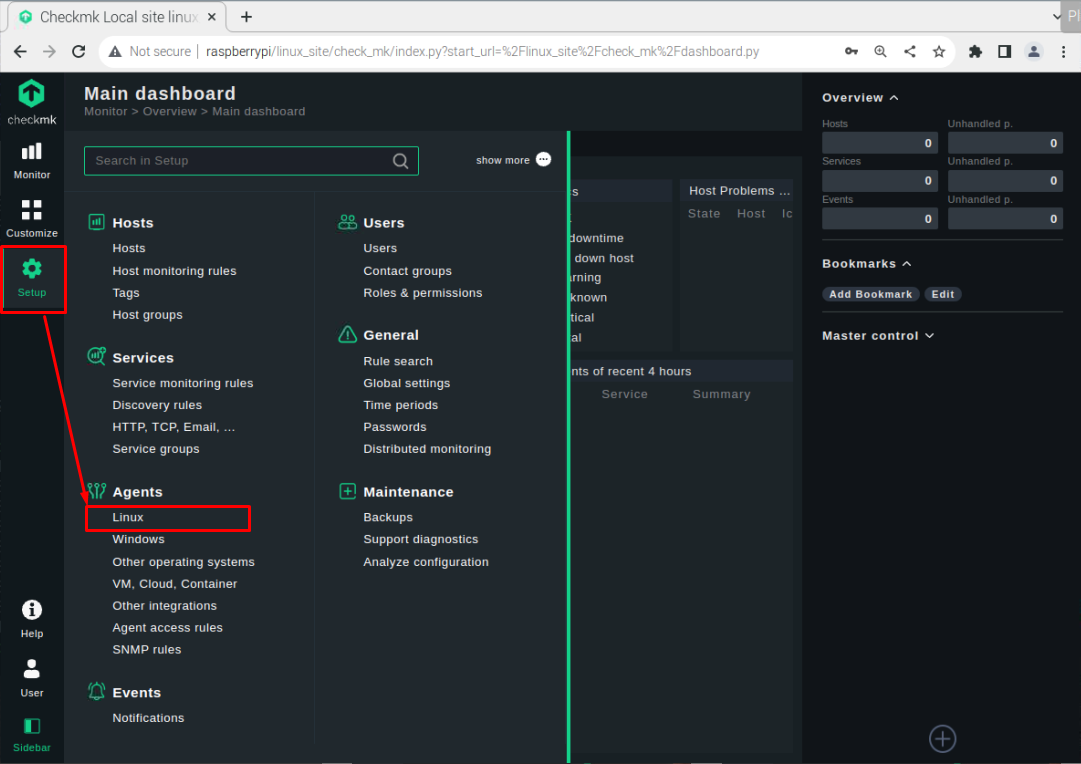
There you will be an agent. You can download the agent “deb” file by clicking on it.
Check for the download directory where the agent deb file is installed. In my case, it’s in the home directory and we need to transfer this file to the location “/omd/sites/<site_name>/tmp” since you are installing this agent for your site. For the transfer to your site location, use the following command:
Replace the <site_name>:
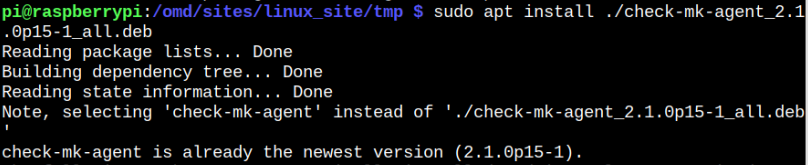
Now, go to your site’s /tmp directory using the “cd” command:

Install the agent deb package through the following command:
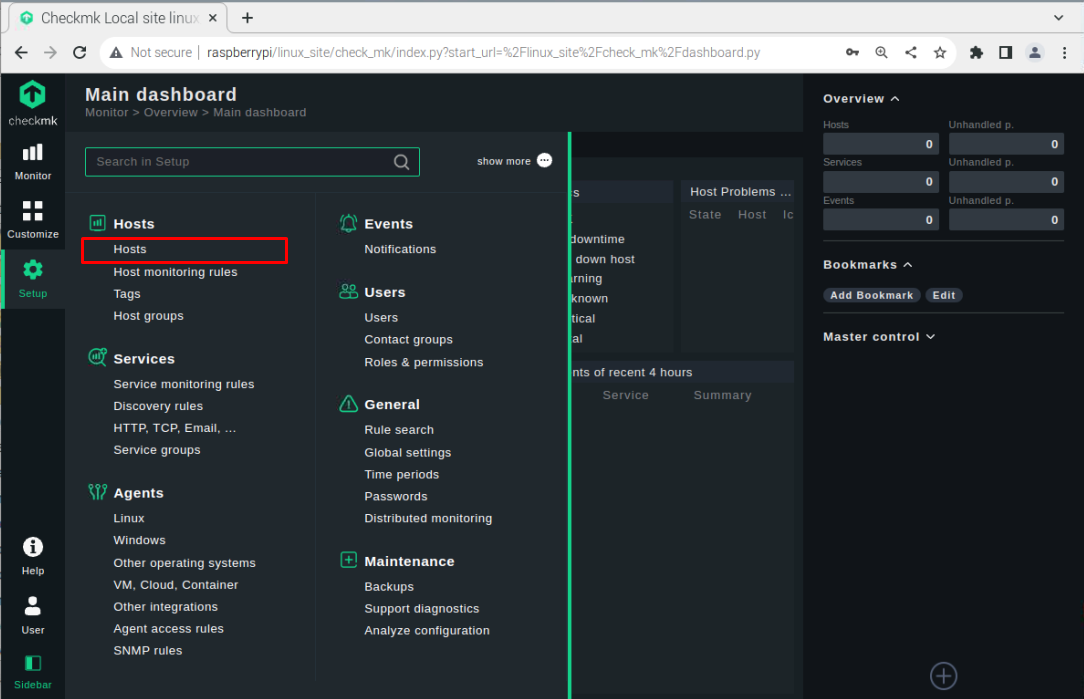
After the installation, go to the “Hosts” option in the “Setup” section.
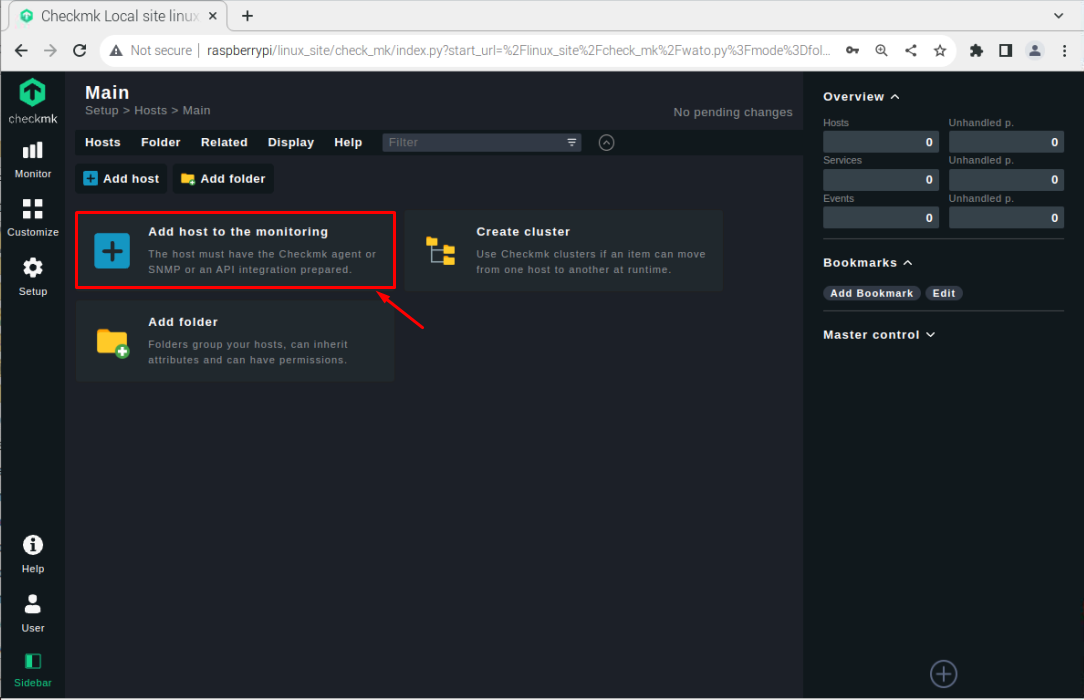
Click on the “Add host to the monitoring” option.
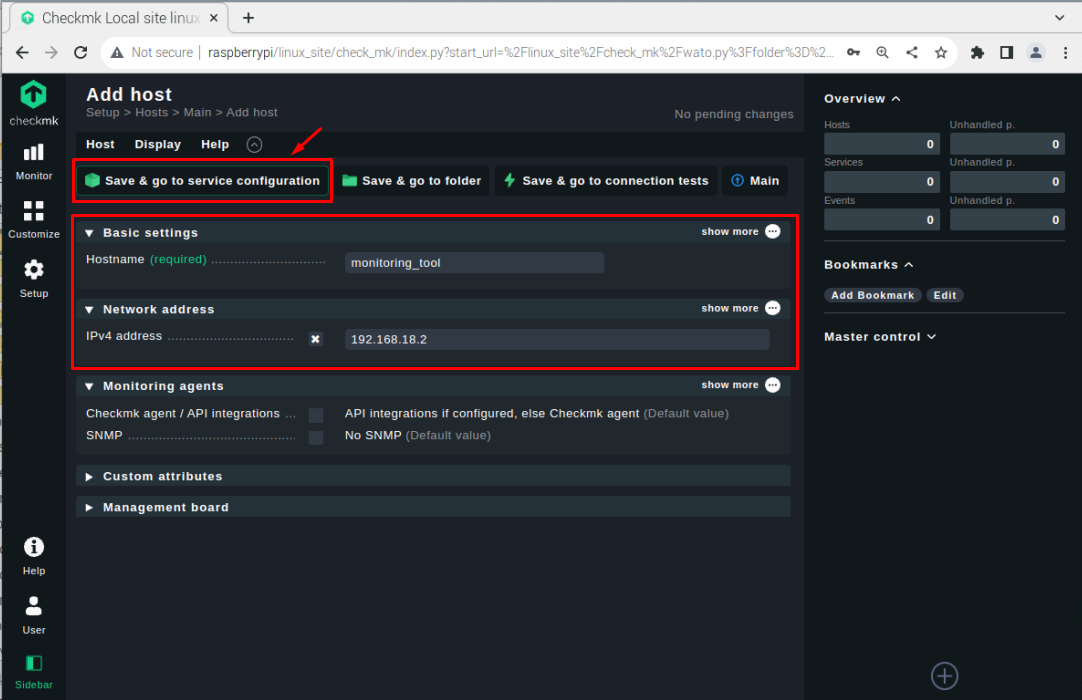
Choose your hostname, write the network address as your Raspberry Pi IP address and click on the “Save and go to service configuration” option.
Note: Use the “hostname -I” command to find the IP address.
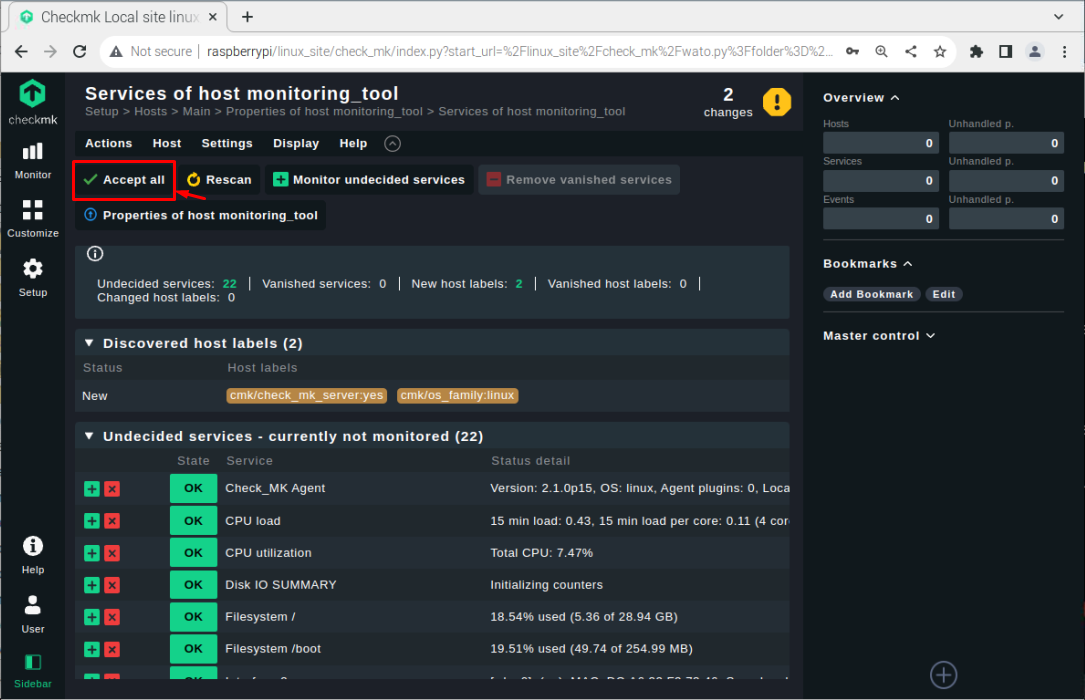
Select the services according to your choice using the “+” button or you can go with the “Accept all” option to select all services.
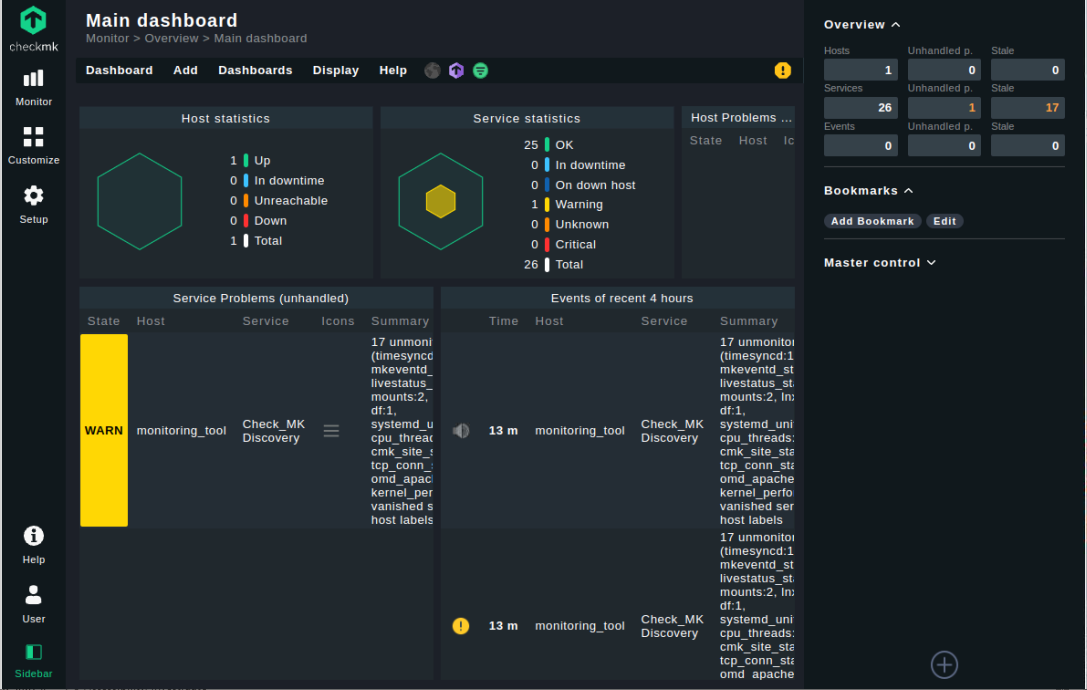
Go to the Checkmk dashboard again to see the changes.
Click on the “Services” option in the “Overview” section to see the list of services where you can monitor your Raspberry Pi resources like CPU Load, utilization and much more.
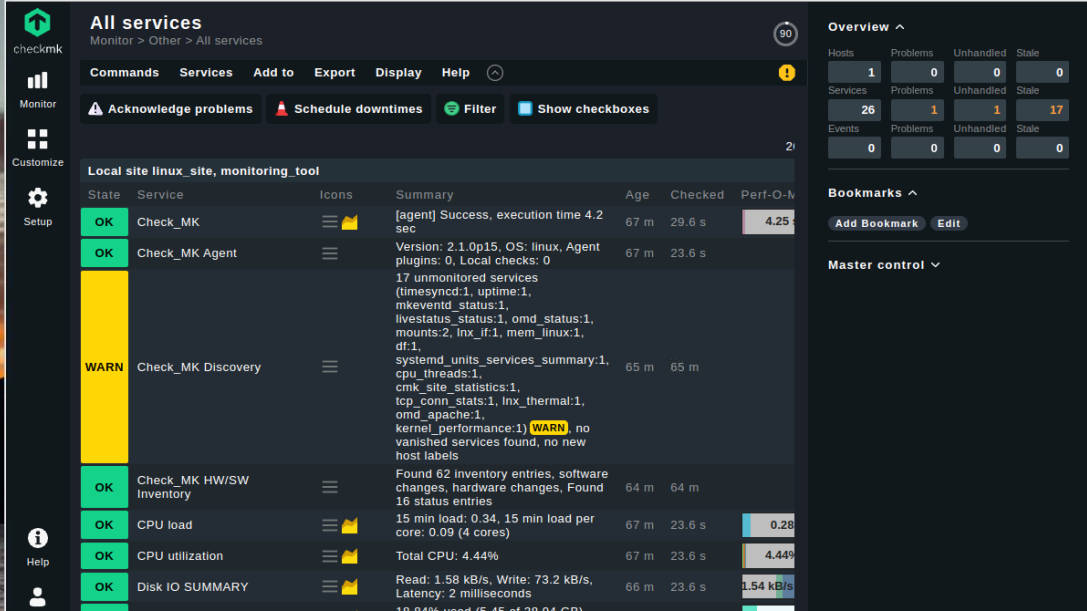
At this point, you have successfully installed an agent for services monitoring on Raspberry Pi.
Conclusion
Checkmk is a valuable tool for monitoring your Raspberry Pi resources like CPU load, CPU utilization, network, file system and much more. You can install this tool using the Debian package. After the installation, you must create a site using the “omd” command and start the site to successfully load it on your Raspberry Pi browser with the login credentials. You must change the password before installing an agent to monitor your Raspberry Pi resources successfully.