If you want to turn your device into a network monitoring device, you should need the services of Darkstat and this article presents an easy guide to installing this application on your Raspberry Pi device.
Install Darkstat on Raspberry Pi
The Darkstat repository is already included in the official repository list of Raspberry Pi; thus, it is easier for you to install it directly on your device. However, before the installation, you must update the packages on your system using the following command:
After successfully updating the packages, use the following steps to complete the Darkstat installation:
Step 1: Install Darkstat on Raspberry Pi
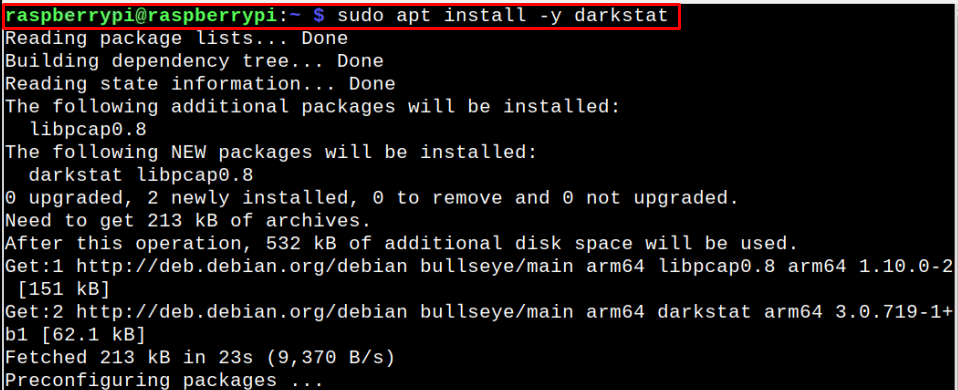
To install Darkstat on Raspberry Pi, use the following command:
After completing the installation, you can use the following command to confirm the latest version of Darkstat installed on your device.

Step 2: Open Darkstat Configuration File
Now, open the Darkstat configuration file on Raspberry Pi via following command:
Inside the file, you will find two options as highlighted in the image below:
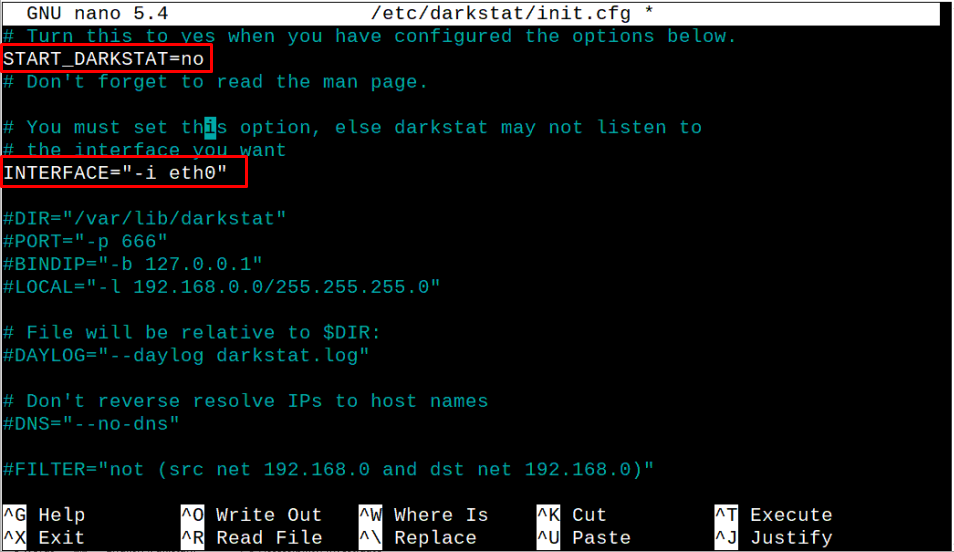
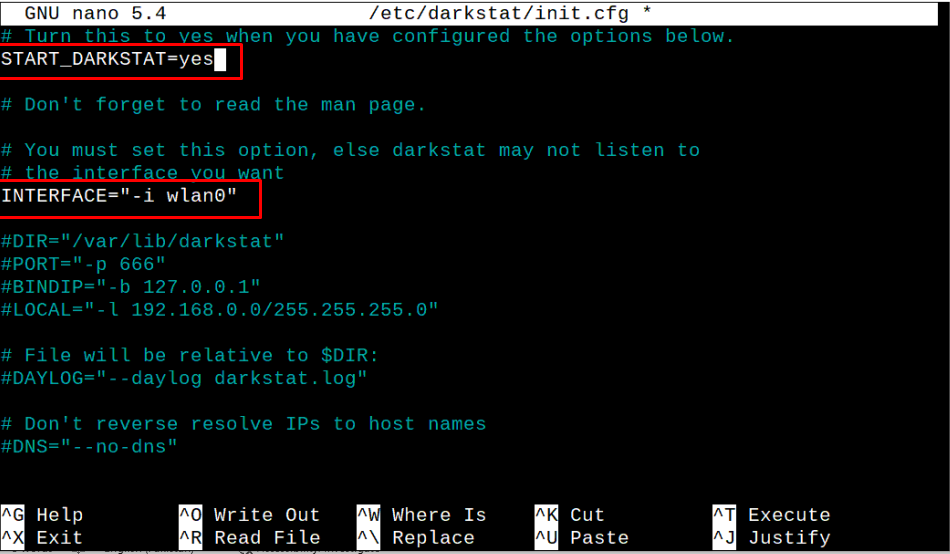
You must turn on the Darkstat service on your Raspberry Pi by relacing “no” with “yes”. Further, you will need to change the interface option in case you use the WIFI connection. If you don’t know your device’s WIFI interface, execute the following command to find out the wireless interface.
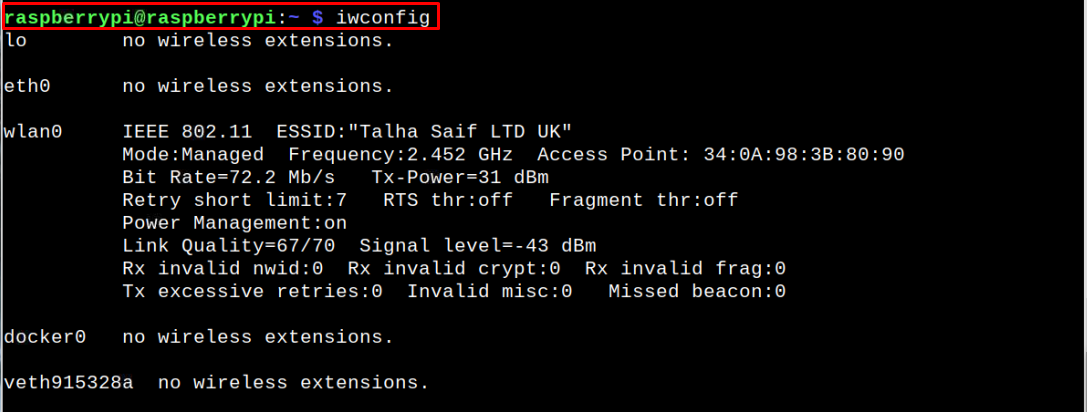
From the above command, you will see your wireless interface, which is “wlan0” in our case. You should change the interface accordingly and once it’s done save this file using “CTRL+X”, add Y and press enter to exit.
Step 3: Restart the Darkstat service on Raspberry Pi
Once you make the changes, restart the Darkstat service on your device using the following command:

After restarting the services, ensure that Darkstat is running with “active (running)” status using the following command:

Step 4: Access Darkstat Web Interface on Raspberry Pi
After ensuring the Darkstat service is active on your device, you can access its web interface using the Raspberry Pi IP address, which you can find through the “hostname -I” command in the terminal.
Once the host address is known, you can use the address “http://hostaddress:667” on your browser to open the Darkstat web interface.
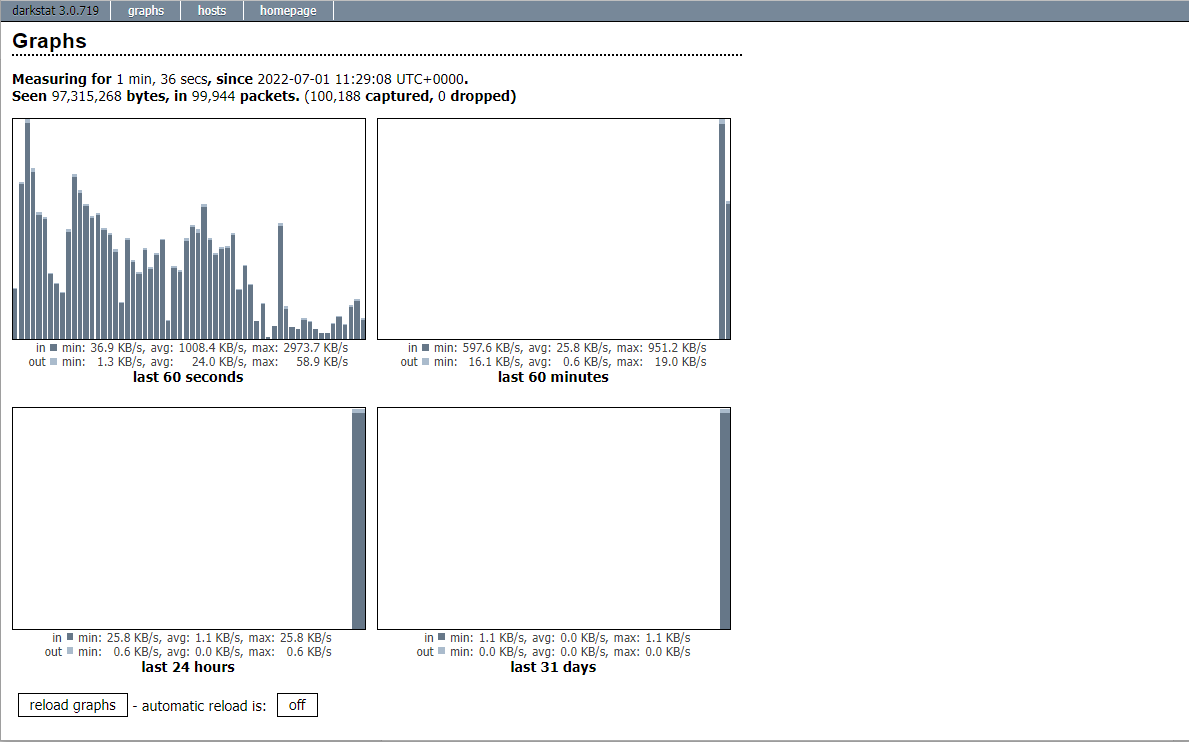
At the above web interface, you can see your network traffic of different timings and it ensures that you have successfully set up the Darkstat service on your Raspberry Pi device.
Removing Darkstat on Raspberry Pi
To remove Darkstat on Raspberry Pi, you should execute the following command:
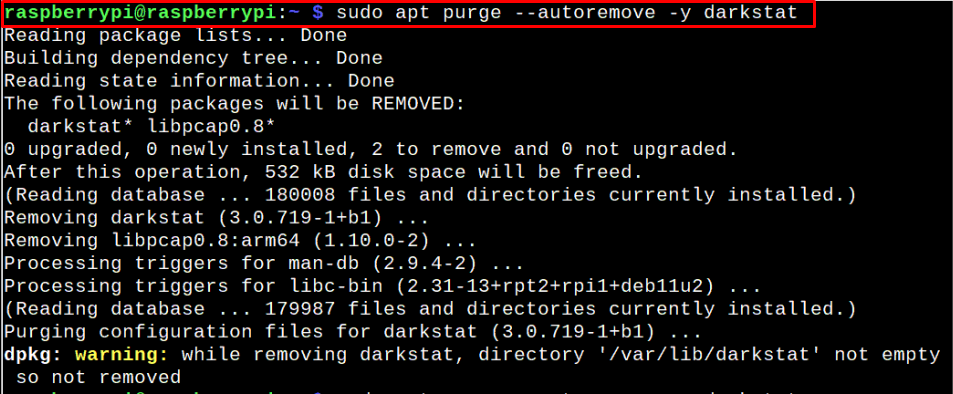
The above command will remove the application on your Raspberry Pi device; however, it doesn’t remove the “/var/lib/darkstat” folder from your device. To remove it, you will need to execute the following command:

Conclusion
Darkstat is a cross-platform tool used for monitoring the network traffic on Linux-based systems. You can easily install this application on your Raspberry Pi device through the steps mentioned above that require a direct installation command and some changes in the configuration file to make it accessible on your system browser using the device’s IP address.