This Linux tutorial explains how to use the Darkstat network analyzer.
Darkstat is a network analyzer which reports statistics on network traffic including ports and protocol usage, general statistics and data on each connection, identified by the remote IP address.
It is very easy to install and use from the web interface.
This article covers the installation for both Debian and RedHat and their based Linux distributions (Ubuntu, Mint, CentOS, Fedora, etc). Instructions also include Darkstat configuration and usage, valid for all Linux distributions.
All steps described below include screenshots, making it easy for every Linux user to follow them.
Installing Darkstat on Debian-Based Linux Distributions (Ubuntu, Mint, etc.)
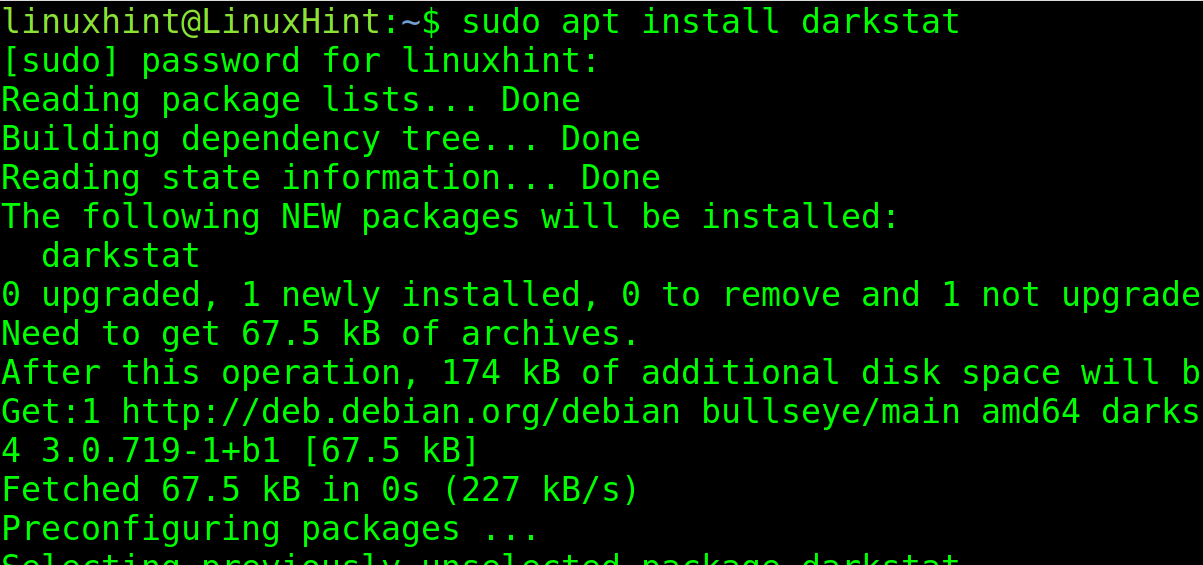
You can install Darkstat on Debian and derived Linux distributions using the apt packages manager as shown in the following figure.
Installing Darkstat on RedHat-based Linux Distributions (CentOS, Fedora, etc.)
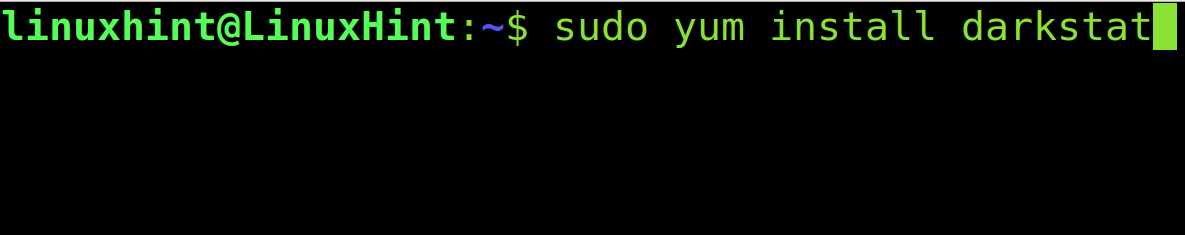
On RedHat based Linux distributions use the yum packages manager as shown in the screenshot below.
Configuring Darkstat
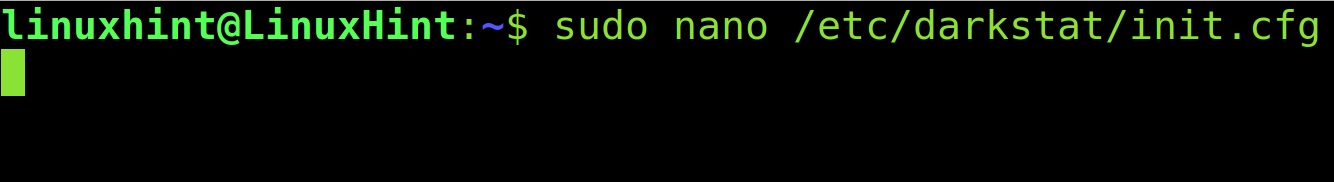
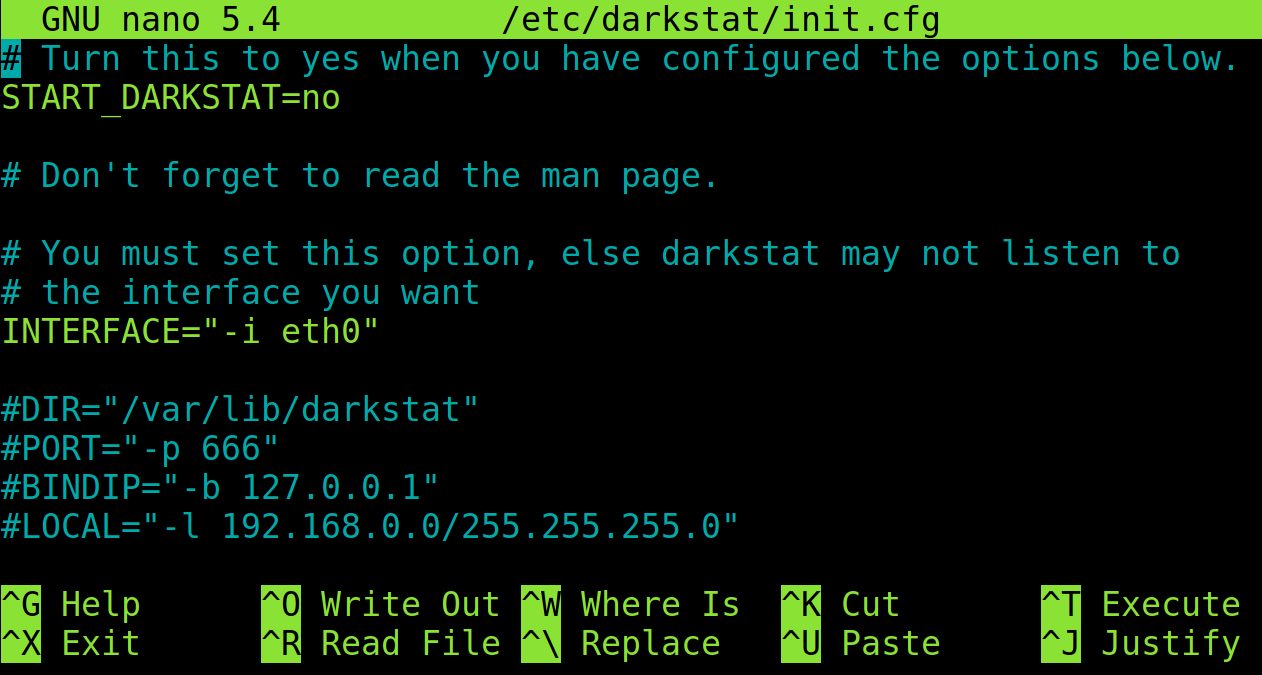
Darkstat configuration file is /etc/darkstat/init.cfg, before running Darkstat it needs to be edited.
Use any text editor to open it with privileges (sudo).
Replace “START_DARKSTAT=no” with “START_DARKSTAT=yes”. Also replace the interface “eth0” with yours. Then, uncomment 4 lines below.
This is how your file needs to look after editing. Where <Network-Device> is your network card name, in my case wlp3s0.
START_DARKSTAT=yes
# Don't forget to read the man page.
# You must set this option, else darkstat may not listen to
# the interface you want
INTERFACE="-i <Network-Device>"
DIR="/var/lib/darkstat"
PORT="-p 666"
BINDIP="-b 127.0.0.1"
LOCAL="-l 192.168.0.0/255.255.255.0"
See the arrows in the following screenshot:
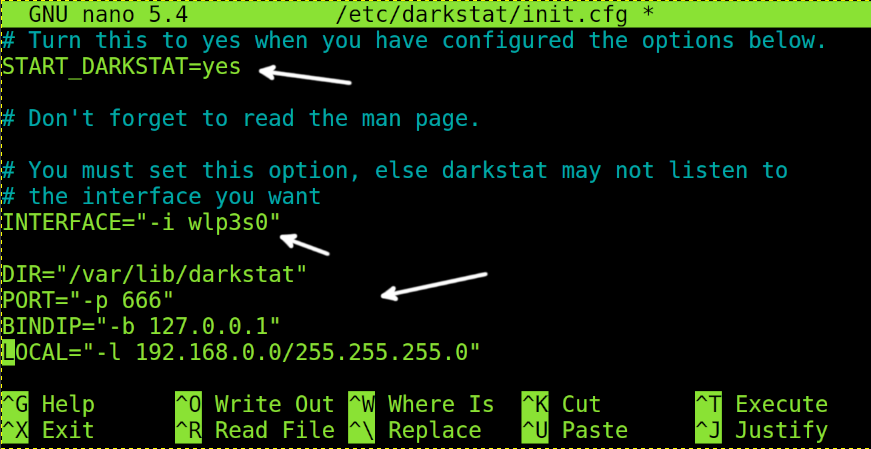
Exit saving changes, your system is ready to launch Darkstat.
Getting Started With Darkstat
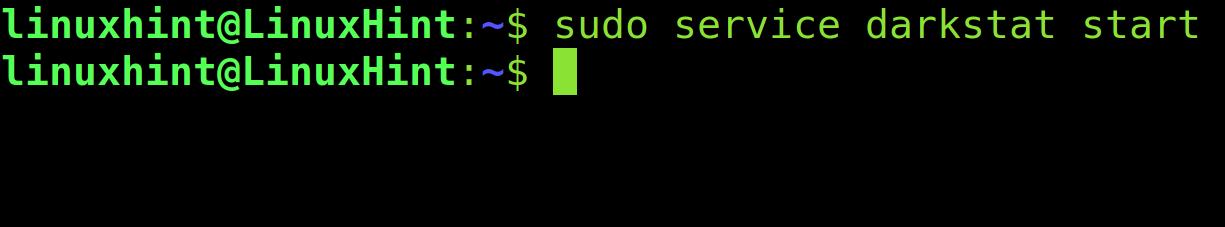
Before launching Darkstat, start or restart the service to fetch the new configuration you just made.
Use the following command to start the Darkstat service:
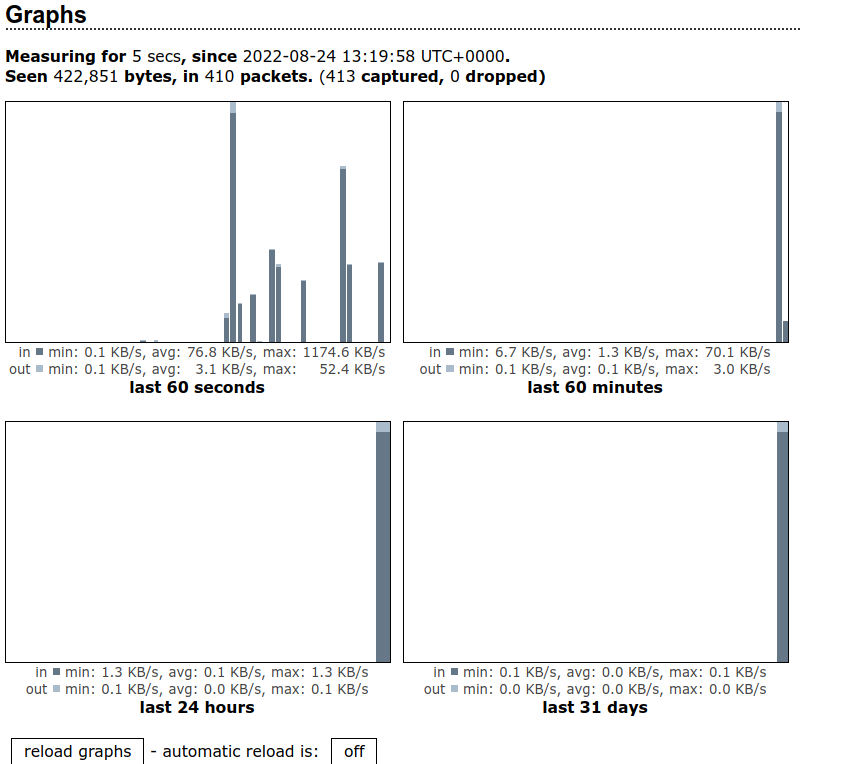
After running the service, you can access the web interface through the computer IP followed by the port 666, or through local URLs http://127.0.0.1:666 or http://localhost:666.
After accessing, the Graphs screen will display statistics for the last 31 days, last 24 hours, last hour and last minute.
In my case I just installed Darkstat, so it didn’t manage to collect statistics and it’s only showing last-minute traffic.
Graphs show minimum, maximum, and average speed for both incoming and outgoing traffic.
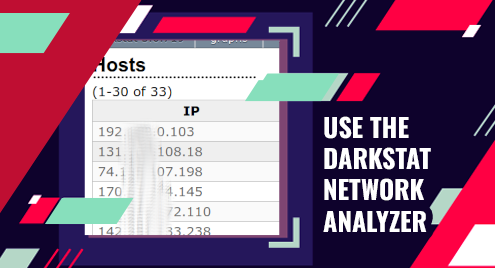
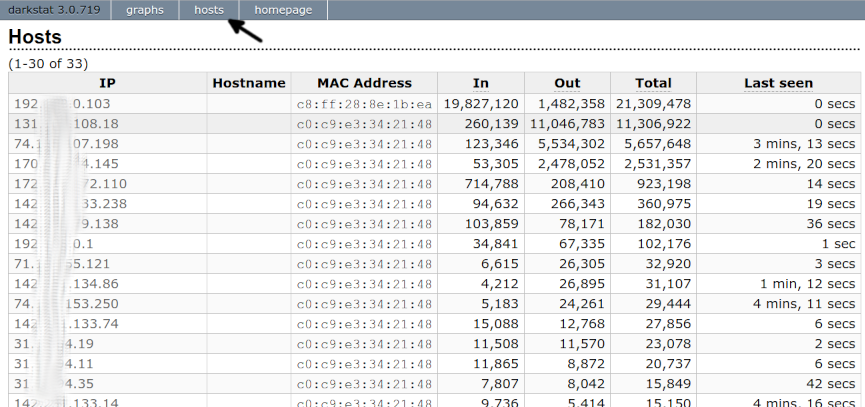
The top menu shows the option hosts. Press it to see statistics by connection.
Darkstat features include the following:
- Easy installation with packages for most popular Linux distributions
- Individual reports per host, port statistics, traffic data
- Integrated web server with deflate compression to display the web interface
- A friendly visual interface compared to other monitoring tools
- Asynchronous reverse DNS resolution using a child process
- Light. Efficient and portable. Single threaded
- Also supports IPv6
Darkstat Alternatives
The best of Darkstat probably is its web interface. But, there are many alternatives also for the Linux terminal, several were explained in the tutorials Monitoring Linux Network Stats and How to do a Linux Network Speed Test.
You can find the following Darkstat alternatives:
- IFTOP: This is a good alternative because it also displays information on individual connections. This tool works in the Linux terminal. On Debian and Ubuntu, this can be installed from the apt packages manager.
- TCPTRACK: This alternative also displays information on individual connections including remote IP address and port, connection state, idle time, and individual connections information.
- NLOAD: NLOAD is a ncurses-based web analyzer used to research bandwidth usage.
- IFSTAT: Another alternative to Darkstat which reports interface activity and can be installed using the packages manager.
- MUNIN: MUNIN is another network monitoring tool which allows you to write your own plugins in a variety of languages. It also can be installed from repositories.
Conclusion:
As you can see, installing and using the Darkstat network analyzer is pretty simple. Any Linux user is able to achieve it by following simple instructions provided in this document. Darkstat is an excellent tool for network administrators looking to improve bandwidth allocation and policies. The web interface and embedded server make it very friendly, both in its interface and remote accessibility. Yet users may want to check alternatives, especially useful for devices without a graphical environment. Now, you can track connections based on statistics, at domestic level and for example, terminate them when you need bandwidth for a specific task.