The users should follow this guide to install this tool on the Raspberry Pi system.
Monitor Raspberry Pi Performance Using atop Utility
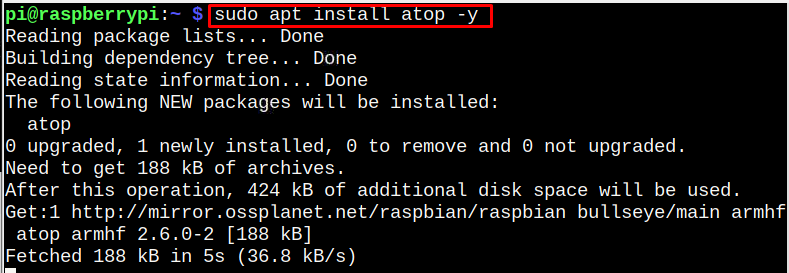
You can install atop on the Raspberry Pi system source repository via the following command:
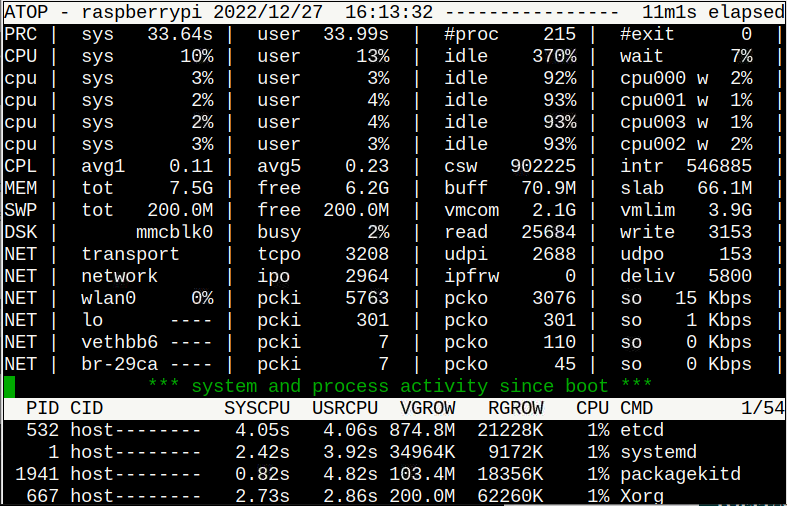
After the installation, enter the “atop” command on Raspberry Pi from the terminal to run the utility:
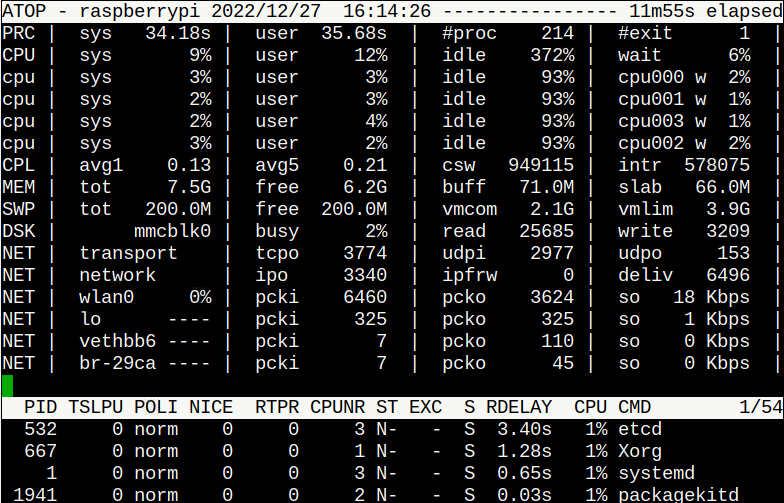
The above command updates the information every 10 seconds. The same command can be used differently using flags to get different results on the terminal.
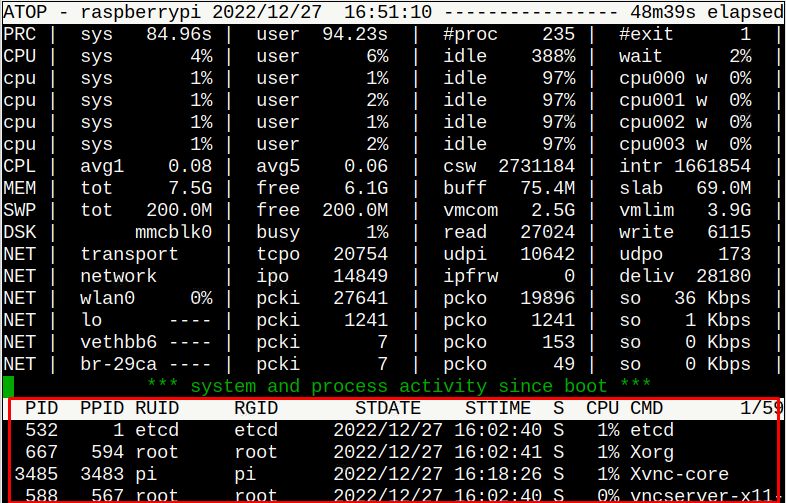
If you use the “-s” flag with atop command, it provides you with the information of active running process on the system:
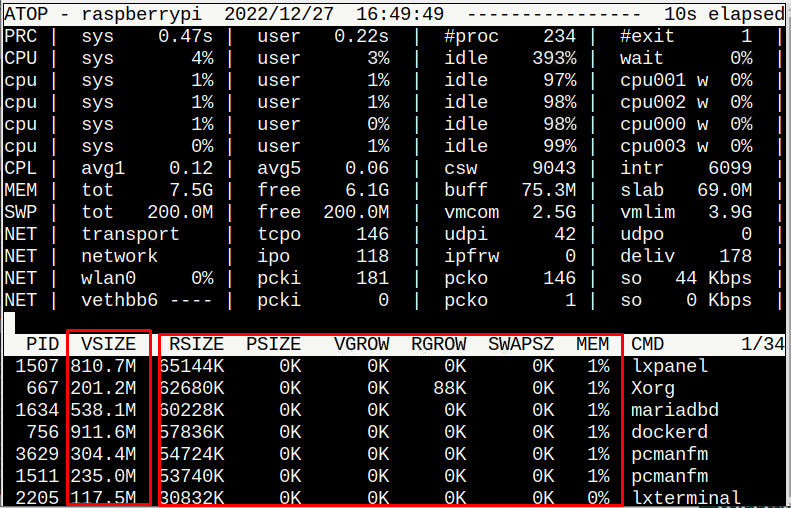
To retrieve memory usage information by each active process, you can use the following command:
If you are interested in finding the more specific data of running processes on Raspberry Pi system, you can use the following command:
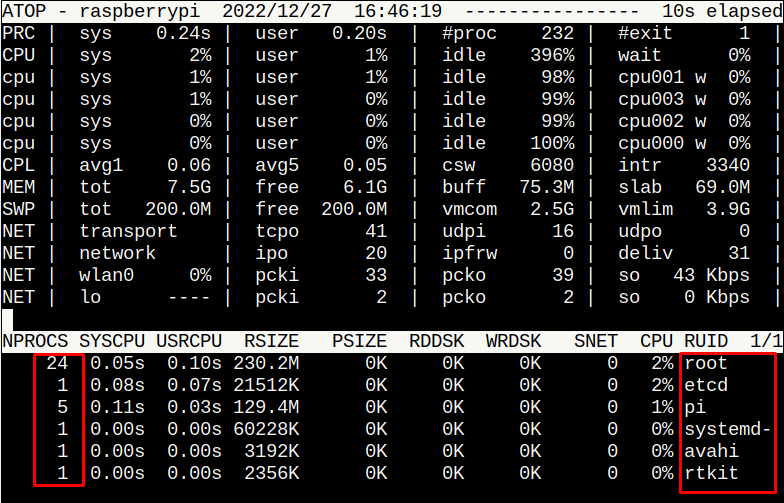
To find the list of active users and the number of processes run by the users on Raspberry Pi system, you can use the following command:
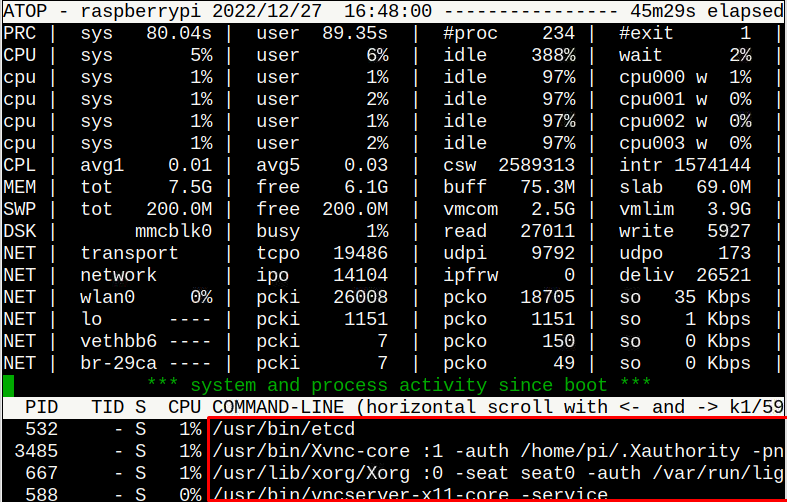
To see the commands related to the running process on Raspberry Pi system, you can use the following command:
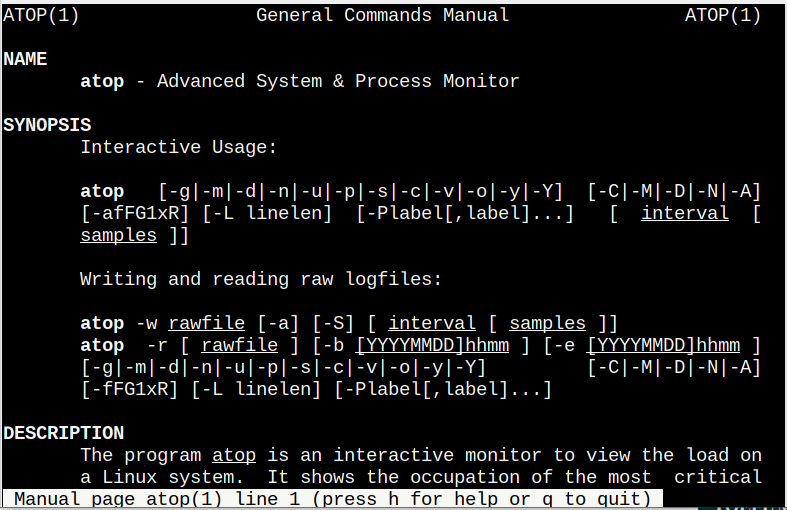
To learn about other commands and get detailed about the information revealed at the atop output, you can open the manual using the following command:
Read it out in case you need help using other commands for Raspberry Pi system monitoring.
Conclusion
The atop is a lightweight command-line utility for advanced system and process monitoring. It helps Raspberry Pi users analyze, debug, configure or kill processes that affect your system. It can easily be installed on a Raspberry Pi system from the source repository and you can use different atop commands to analyze your system performance in different ways. You can also open atop manual using the “man” command to get further guidance about different commands that can be used on the Raspberry Pi system.

