How to use serial plotter of Arduino IDE
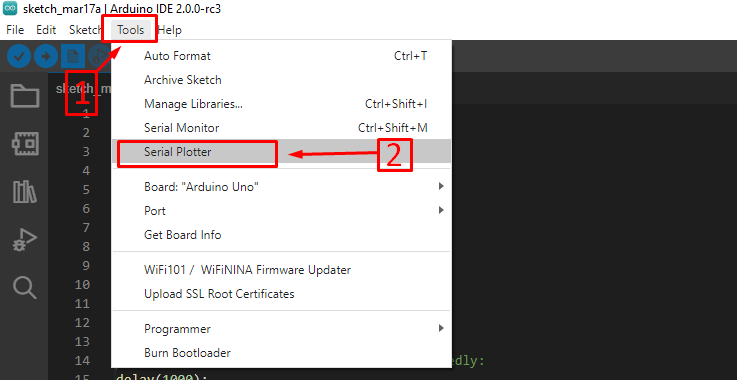
Serial plotter is a display option of Arduino IDE that displays the serial data into graphical form and provides an easy way to interpret the parameters of the Arduino code. The image below shows how to open the serial plotter of Arduino IDE.
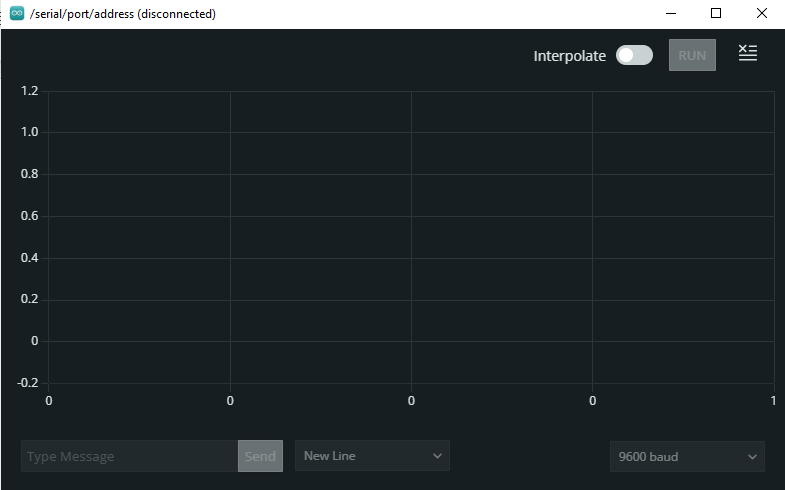
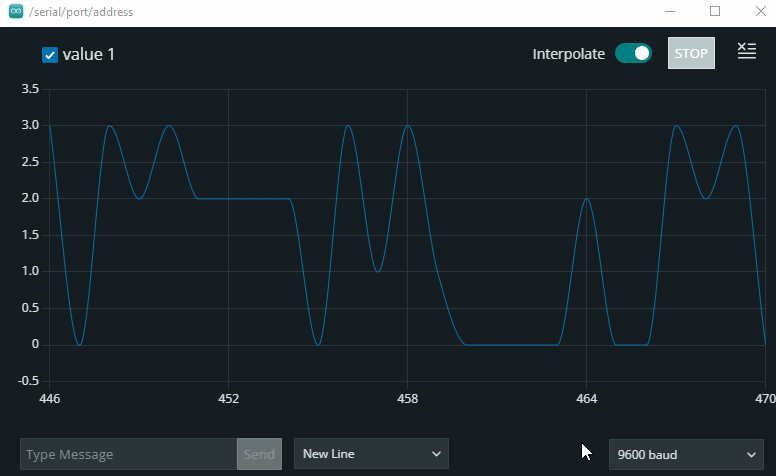
To open the serial plotter, you have to select the Serial Plotter option in the tools menu of the Arduino IDE. After selecting this option serial plotter will open as shown in the image below:
Further to explain how we can use the serial plotter of Arduino IDE we have plotted the values of potentiometer and temperature sensor on the serial plotter. One thing to remember is that to plot the values on a serial monitor it is necessary that first the values must be printed on the serial monitor.
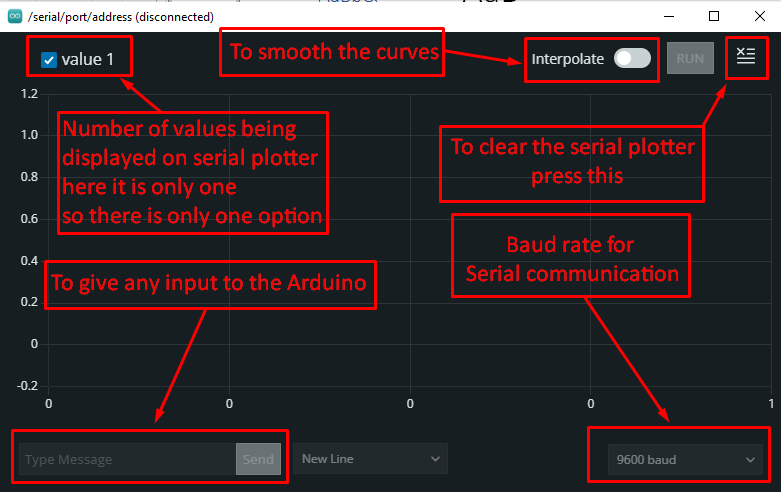
The figure above shows the detailed description of the option available in the serial plotter. The further explanation for each option is also given below:
- To clear the serial plotter, you have to click the topmost extreme right icon of the serial plotter
- To make the graph smoother you can turn the interpolate icon on present next to the run button of the serial monitor.
- If there are more than one inputs and outputs of the Arduino program, then you will see value 1 value 2 and so on. You can further select the values by clicking on the box before the value name which you want to plot as well to get a better comparison of the values.
- To select the rate for serial communication you can use the option in the bottom extreme right of the serial plotter.
- To give the input to Arduino using the serial communication you can enter the values using the bottom extreme left option in the serial plotter.
- If you want to stop the serial plotter for plotting values any further, you can press the icon next to the icon used for clearing the serial plotter.
How to display the values of potentiometer on Arduino serial plotter
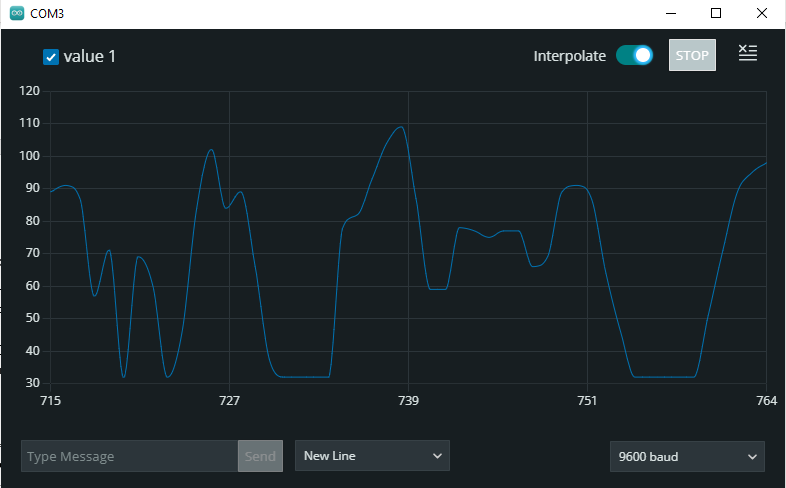
To demonstrate the use of a serial plotter we have plotted the values of the potentiometer and as we rotate the knob of the potentiometer the graph of values will change. The Arduino code to display the values of potentiometer is given below:
int pot=A0;/* assigning analog pin of Arduino to potentiometer */
void setup() {
Serial.begin(9600);/* giving baud rate for serial communication */
pinMode(pot, OUTPUT);/* defining the working mode of potentiometer */
}
void loop() {
value=analogRead(pot);/* getting the values of potentiometer*/
Serial.println(value);/* printing the value of potentiometer on serial plotter*/
delay(1000);/* giving the time of one second after which the loop section will run again */
}
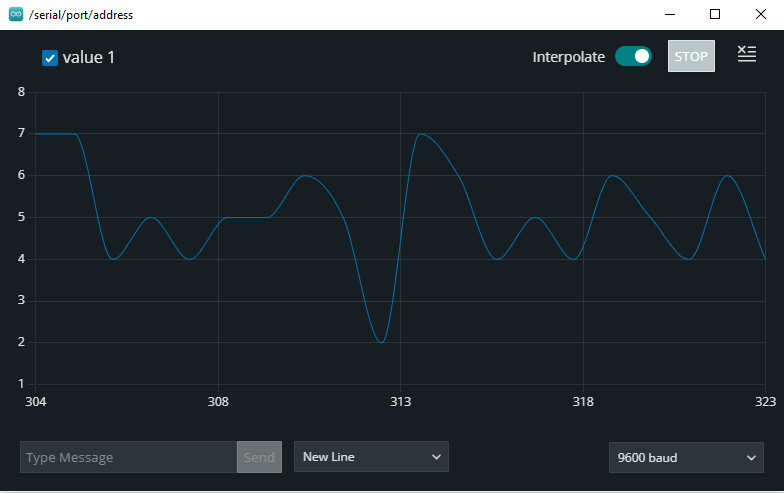
We have given the image below that displays the potentiometer values on the serial plotter as we turn the knob the graph of the values changes. We have made the curves smoother by turning on the interpolate option.
The animated GIF below shows how serial plotter plots the values of the serial monitor.
How to display values of temperature sensor on serial plotter
We have used LM35 as the temperature sensor and plotted its values on the serial monitor and for that purpose, we have programmed the microcontroller. The Arduino sketch for plotting the LM35 values on serial plotter is given below:
int sensor=A0;/* assigning analog pin of Arduino to LM35 */
int temp;
int tempF;
int value;
void setup() {
Serial.begin(9600);/* giving baud rate for serial communication */
pinMode(sensor, INPUT);/* defining the working mode of LM35 */
}
void loop() {
value=analogRead(sensor);/* getting the values of LM35*/
temp=value*0.488;/* converting the values in degree Celsius */
tempF=temp*9/5+32;/* converting the values in Fahrenheit*/
Serial.println(tempF);/* printing the value of LM35 on serial plotter*/
delay(1000);/* giving the time of one second after which the loop section will run again */
}
To find the temperature we have first converted the analog values of LM35 into degree celsius by using the following formula. To further understand the calculations visit here .
After getting the values in degrees we have converted them into the fahrenheit using the following formula:
We have only displayed the temperature values in fahrenheit in the serial monitor so only fahrenheit values of temperature are plotted in the serial plotter.
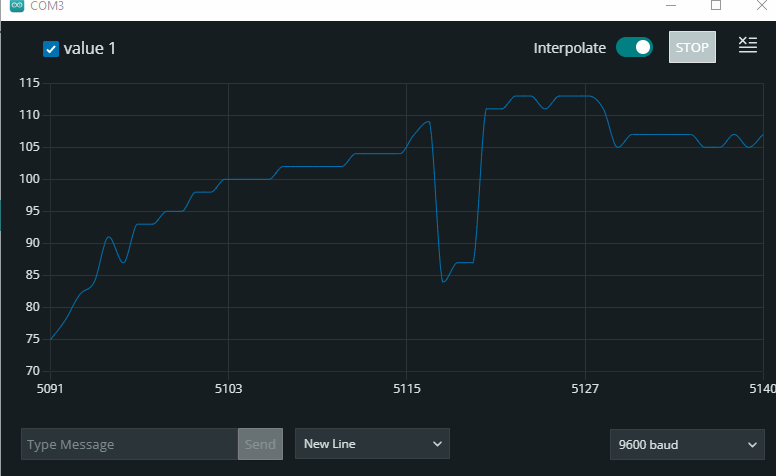
The graph for the temperature values in Fahrenheit is shown in the image below:
Below we have given the animation of the graph plotting the values of temperature and on the horizontal axis represents the number of values that are taken of temperature. Whereas, on the vertical axis the temperature values in the fahrenheit are given and as you can see the temperature values are continuously changing because of change of temperature in the surroundings of LM35.
Conclusion
Serial plotter is the best option for plotting the graph of the values of Arduino program and using the serial plotter we can also compare two or three values with each other. To use a serial plotter, we have first described all of its options briefly and then for illustration purposes plotted some values. Further we have also provided the animated GIF of values by the potentiometer and LM35 along with the Arduino code.

