In this article, I will show you how to monitor the network of a home router (TP-Link Archer C5 V4) with Prometheus and Grafana. So, let’s get started.
Table of Contents
- Prerequisites
- Enabling SNMP on Network Devices
- Installing SNMP Exporter
- Adding SNMP Exporter to Prometheus
- Creating a Grafana Dashboard for Monitoring Network Devices
- Set a Default Grafana Dashboard
- Where to Go Next?
- Conclusion
- References
Prerequisites
To try out the examples of this article, you must have Prometheus and Grafana installed on your computer, and Prometheus added to Grafana as a data source.
If you need any assistance on installing Prometheus on your computer, check out the article How to Install Prometheus on Ubuntu 20.04 LTS.
If you need any assistance on installing Grafana on your computer and learning the basics of Grafana, check out the article (How Do I Connect Grafana with Prometheus).
Enabling SNMP on Network Devices
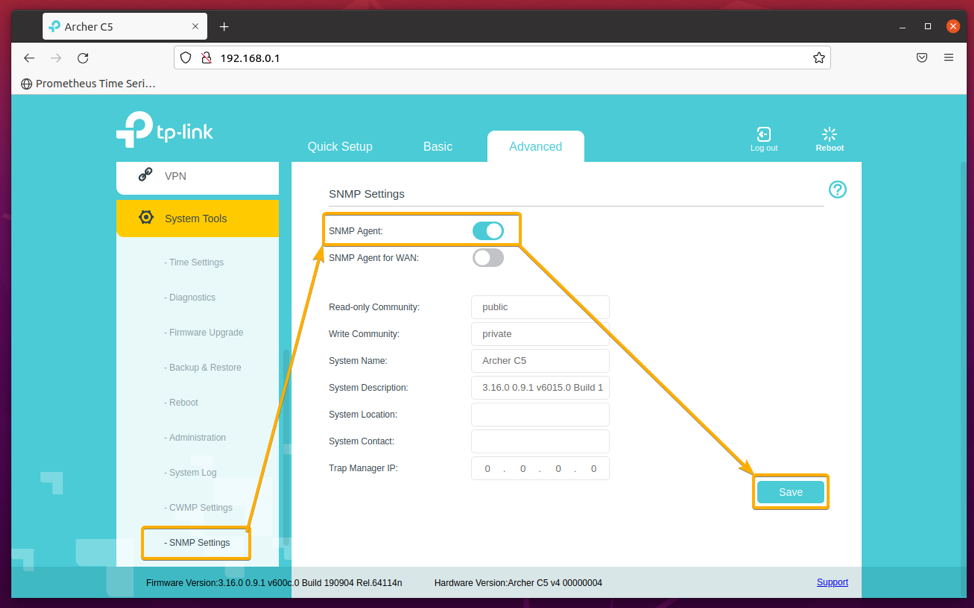
If you want to monitor a network device with Prometheus via SNMP, you must enable SNMP in your network device.
On my TP-Link Archer C5 V4 router, the SNMP settings are in Advanced > System Tools > SNMP Settings > SNMP Agent, as shown in the screenshot below. If you’re also trying to monitor the network of a TP-Link router, then the SNMP settings should be in the same location. Once you’ve enabled SNMP, click on Save for the changes to take effect.
Installing SNMP Exporter
For Prometheus to collect metrics via the SNMP protocol, you must have the Prometheus snmp_exporter installed on your computer and configure Prometheus to use it.
In this section, I will show you how to install the latest version of Prometheus snmp_exporter on Ubuntu 20.04 LTS. So, let’s get started.
First, navigate to the ~/Downloads directory as follows:
NOTE: The latest version of Prometheus snmp_exporter is v0.20.0 at the time of this writing. When you’re reading this article, newer versions of the Prometheus snmp_exporter may be released. In that case, you can copy the download link of the latest version of the snmp_exporter and replace it here. You can find the link to the latest version of snmp_exporter on the official snmp_exporter Github release page.
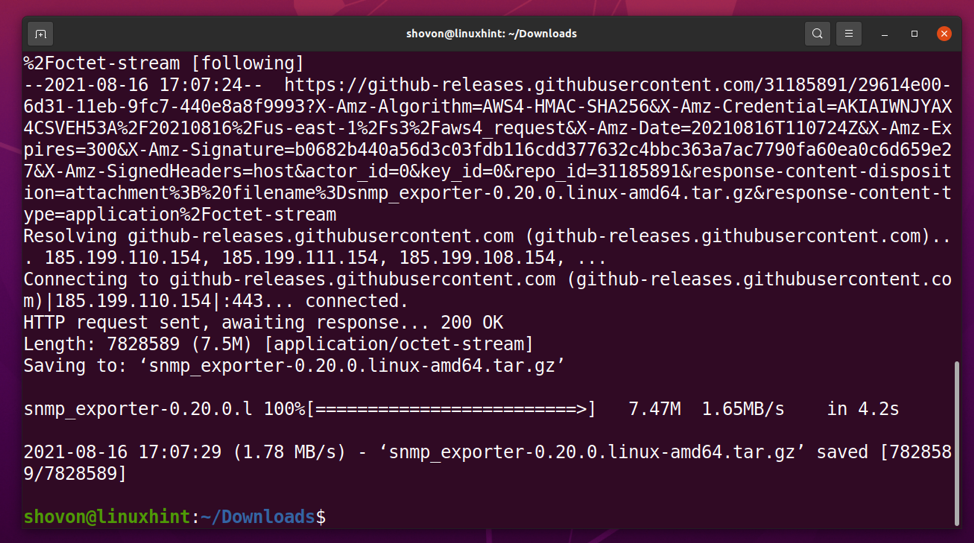
Download the latest version of the Prometheus snmp_exporter with the following command:
Prometheus snmp_exporter archive should be downloaded.
You should find a new file snmp_exporter-0.20.0.linux-amd64.tar.gz in the ~/Downloads directory, as you can see in the screenshot below.
Extract the snmp_exporter-0.20.0.linux-amd64.tar.gz archive on your current working directory as follows:
A new directory snmp_exporter-0.20.0.linux-amd64/ should be created on your current working directory, as you can see in the screenshot below.
Move the snmp_exporter-0.20.0.linux-amd64/ directory to the /opt directory and rename it to snmp_exporter as follows:
The snmp_exporter-0.20.0.linux-amd64/ directory should be moved to /opt and renamed to snmp_exporter/, as you can see in the screenshot below.
In the /opt/snmp_exporter/ directory, the snmp_exporter binary is used to start the snmp-exporter service, and the snmp.yml is the snmp_exporter configuration file.
NOTE: The configuration file snmp.yml is very long, and it’s not advisable to edit it by hand. Instead, you should use the snmp_exporter configuration generator to generate a custom snmp.yml configuration file. It is out of the scope of this article to show you how to use the generator to generate a custom snmp.yml configuration file. If you’re using newer network devices, the default one should be fine. For more information on this, check out the GitHub page of the snmp_exporter configuration generator.
Create a symlink of the snmp_exporter binary in the path /usr/local/bin/snmp_exporter so that the snmp_exporter command is available from the Terminal like any other command.
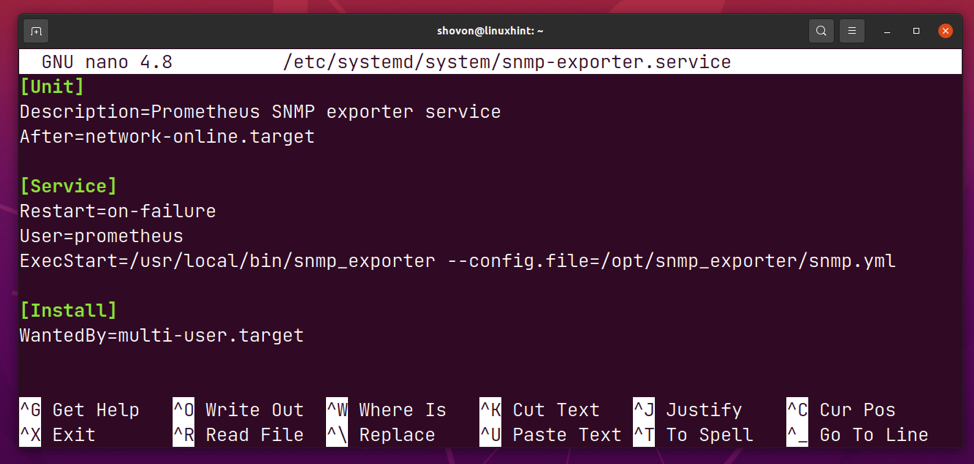
Create a new systemd service file snmp-exporter.service in the /etc/systemd/system/ directory as follows:
Type in the following lines of codes in the snmp-exporter.service file.
Description=Prometheus SNMP exporter service
After=network-online.target
[Service]
Restart=on-failure
User=prometheus
ExecStart=/usr/local/bin/snmp_exporter --config.file=/opt/snmp_exporter/snmp.yml
[Install]
WantedBy=multi-user.target
Once you’re done, press <Ctrl> + X followed by Y and <Enter> to save the snmp-exporter.service file.
For the changes to take effect, reload the systemd daemons with the following command:
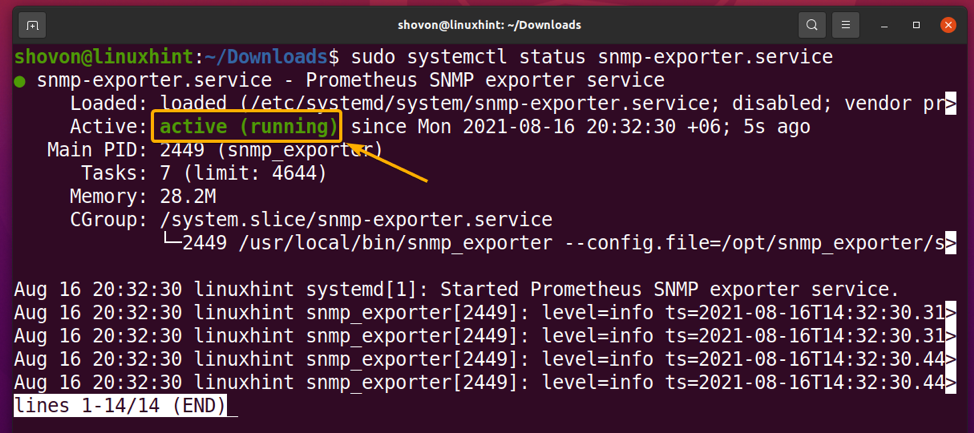
Now, you should be able to start the snmp-exporter systemd service with the following command:
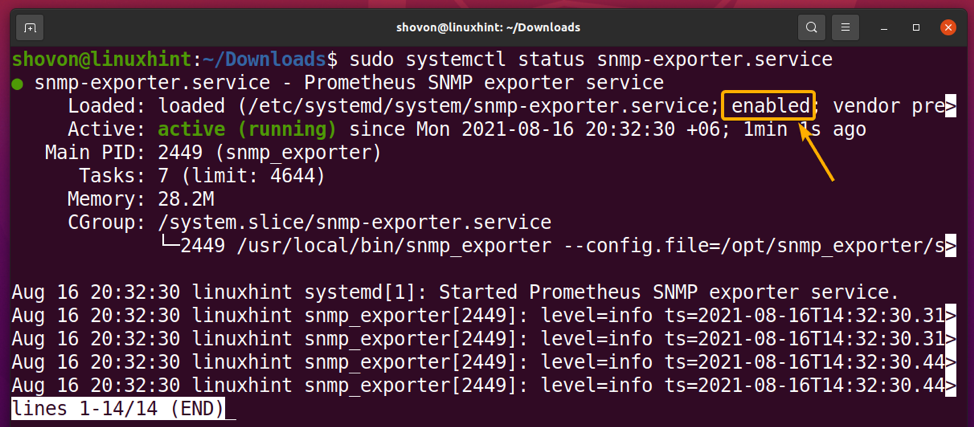
The snmp-exporter systemd service should be active/running, as you can see in the screenshot below.
Run the following command to add the snmp-exporter systemd service to the system startup so that it automatically starts at boot time.
The snmp-exporter systemd service should be enabled (added to the system startup).
The snmp_exporter service should be running on port 9116, as you can see in the screenshot below.
To check whether snmp_exporter can scrape the metrics out of a network device, you need to know the computer’s IP address where snmp_exporter is installed. In my case, the IP address is 192.168.0.117. It will be different for you. So, make sure to replace it with yours from now on.
If your home router uses the IP address 192.168.0.1, navigate to the URL http://192.168.0.117:9116/snmp?target=192.168.0.1 from your favorite web browser to check whether snmp_exporter can scrape the metrics out of your home router via SNMP.
All the properties that the snmp_exporter scraped from your router should be displayed, as you can see in the screenshot below. So, snmp_exporter is working just fine.
Adding SNMP Exporter to Prometheus
Now that you have installed snmp_exporter and it’s working, you have to add it to Prometheus to be able to monitor the snmp_exporter metrics.
Open the prometheus.yml configuration file with the nano text editor as follows:
Add the following lines in the scrape_configs section of the prometheus.yml file as marked in the screenshot below. Once you’re done, press <Ctrl> + X followed by Y and <Enter> to save the prometheus.yml file.
static_configs:
- targets: ['192.168.0.1']
metrics_path: /snmp
params:
module: [if_mib]
relabel_configs:
- source_labels: [__address__]
target_label: __param_target
- source_labels: [__param_target]
target_label: instance
- target_label: __address__
replacement: localhost:9116
Here, in the targets section, you add the IP addresses of the network devices you want to monitor. In this case, my home router with the IP address 192.168.0.1.
If you want to monitor multiple network devices, you can add them to the targets section as follows:
In the replacement section, replace localhost with the IP address or hostname of the computer where snmp_exporter is running. I am running Prometheus and snmp_exporter on the same computer, so I have used localhost as the hostname of snmp_exporter.
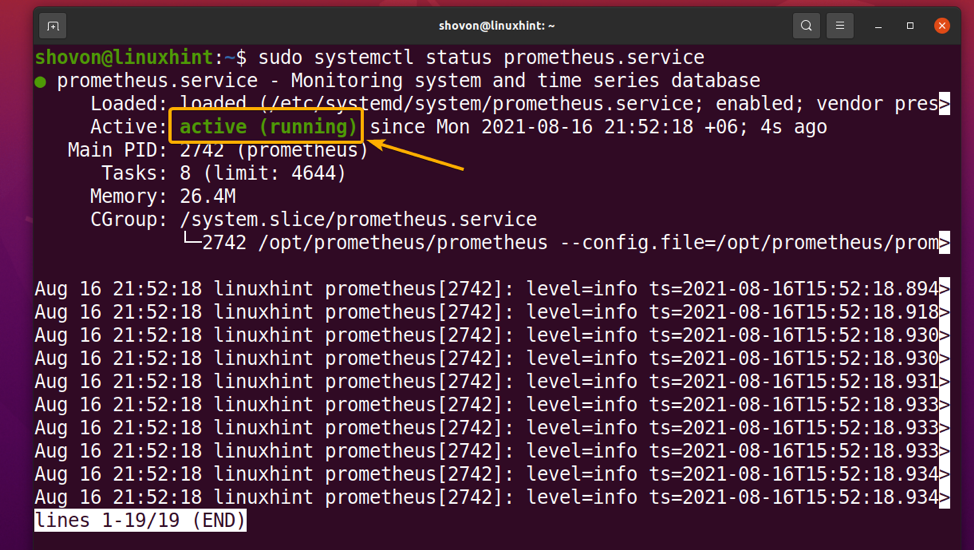
For the changes to take effect, restart the prometheus systemd service with the following command:
If everything is alright, the prometheus service should be active/running.
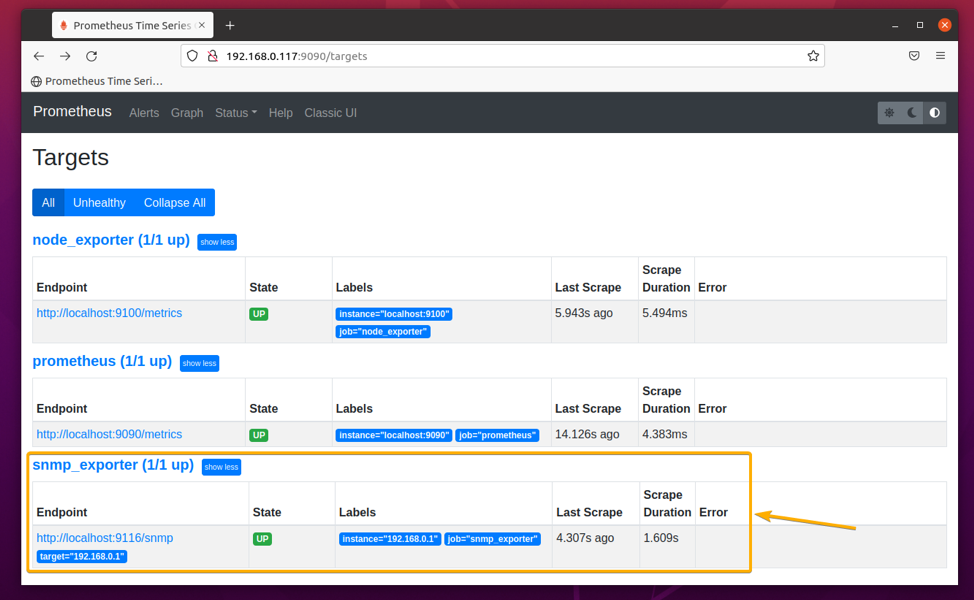
If you navigate to the Targets section of Prometheus Web UI, you should see that snmp_exporter is in the UP state.
Creating a Grafana Dashboard for Monitoring Network Devices
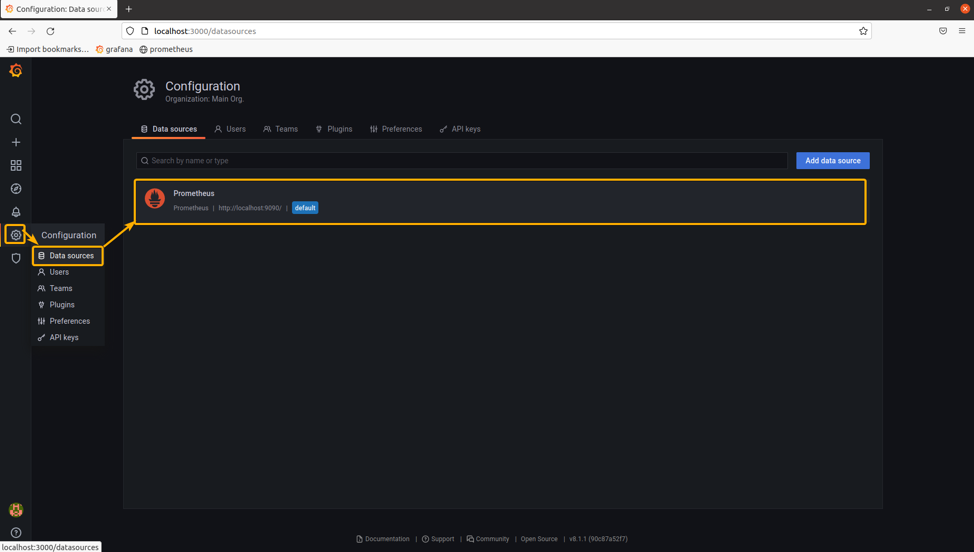
To monitor your network devices with Grafana, you must have Prometheus added to Grafana as a data source.
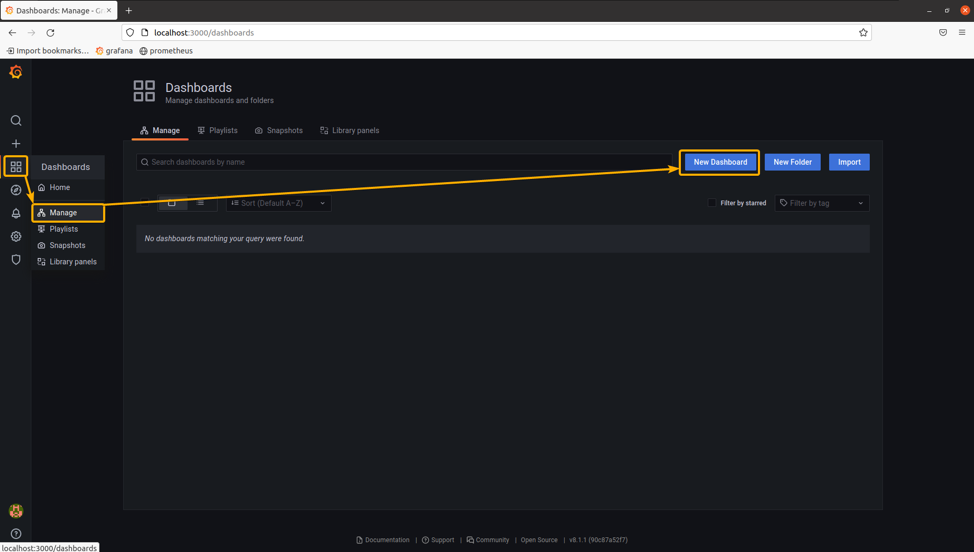
To create a new Grafana dashboard, navigate to Dashboards > Manage and click on New Dashboard as marked in the screenshot below.
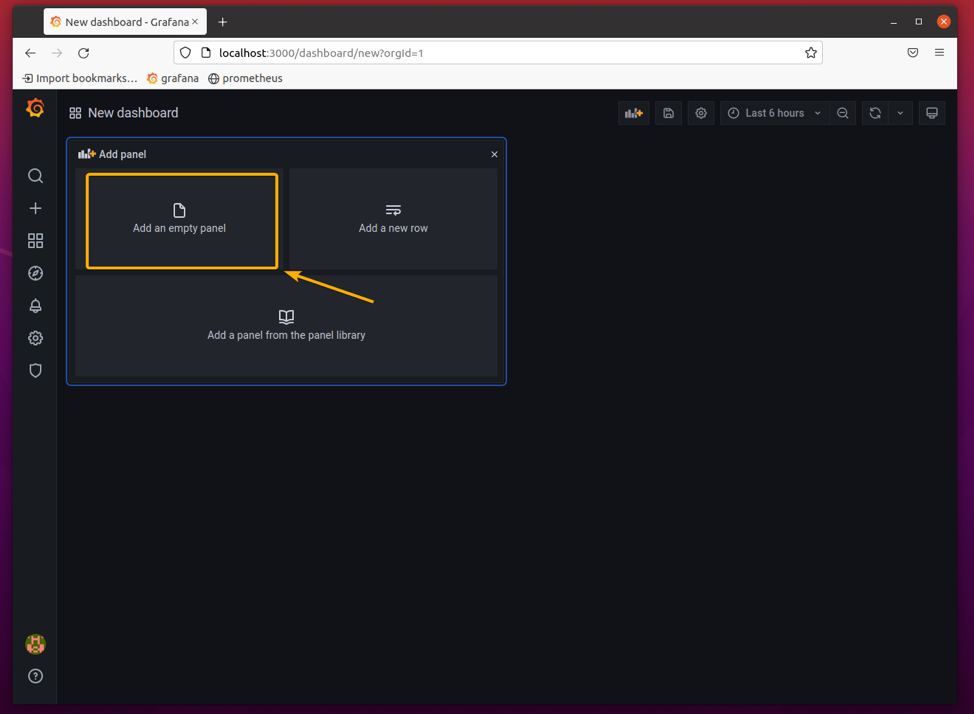
To add a new panel to the dashboard, click on Add an empty panel as marked in the screenshot below.
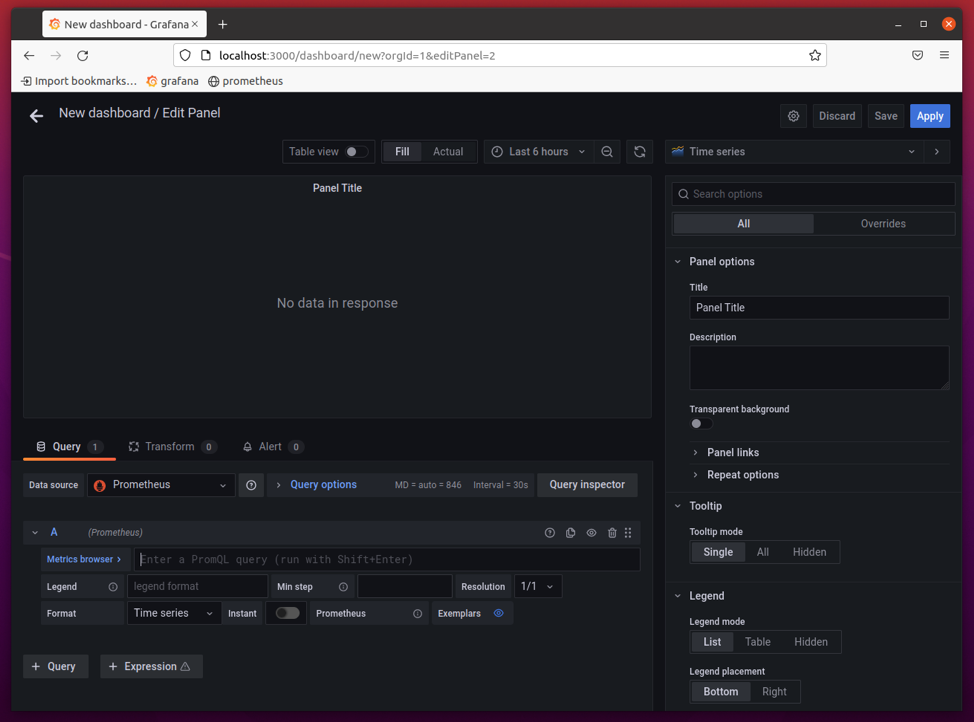
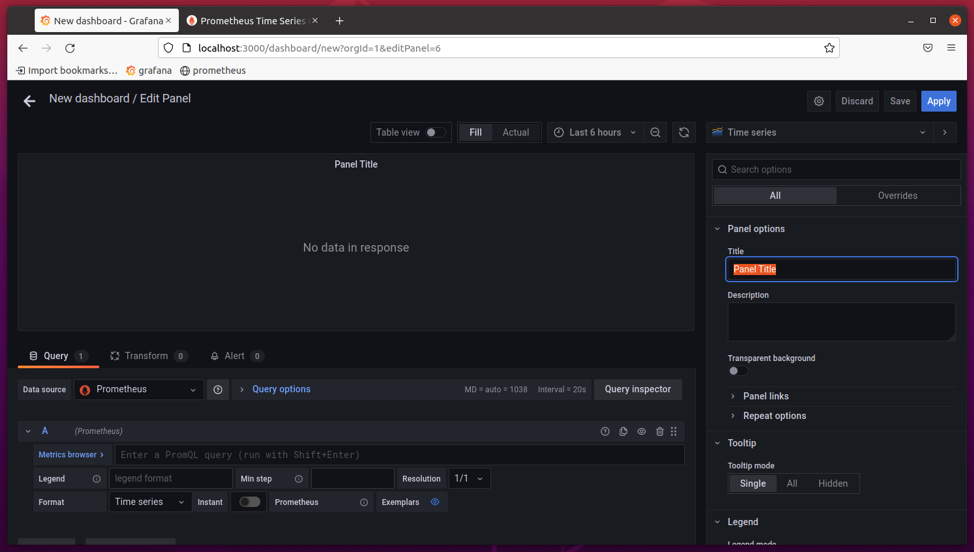
The Grafana panel editor should be opened. You can configure a Grafana dashboard panel from here.
I want to display the following metrics from my TP-Link Archer C5 V4 home router on the Grafana dashboard.
- Router uptime
- Total data downloaded
- Total data uploaded
- Download speed
- Upload speed
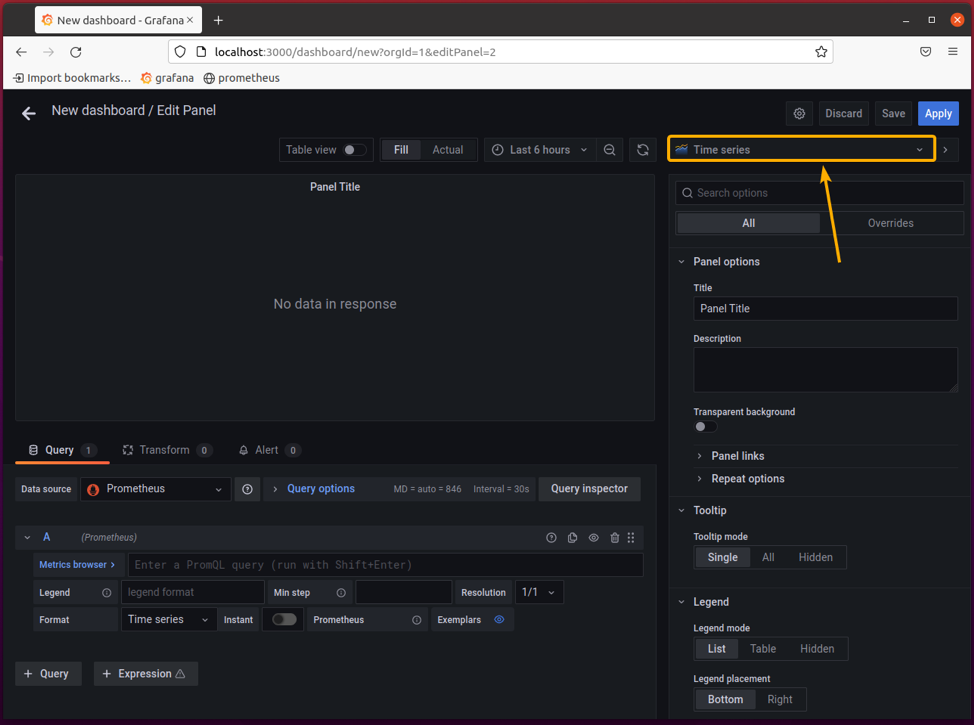
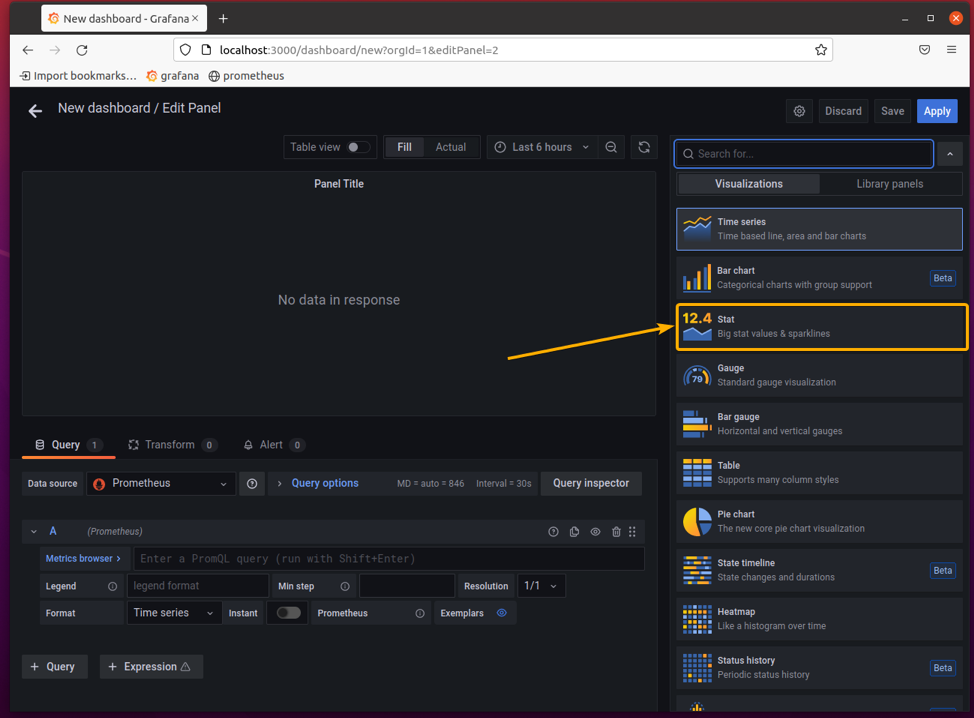
The Router uptime will be a Stat, not Time series. To change the visualization type, click on the dropdown menu as marked in the screenshot below.
Select Stat from the Visualizations section as marked in the screenshot below.
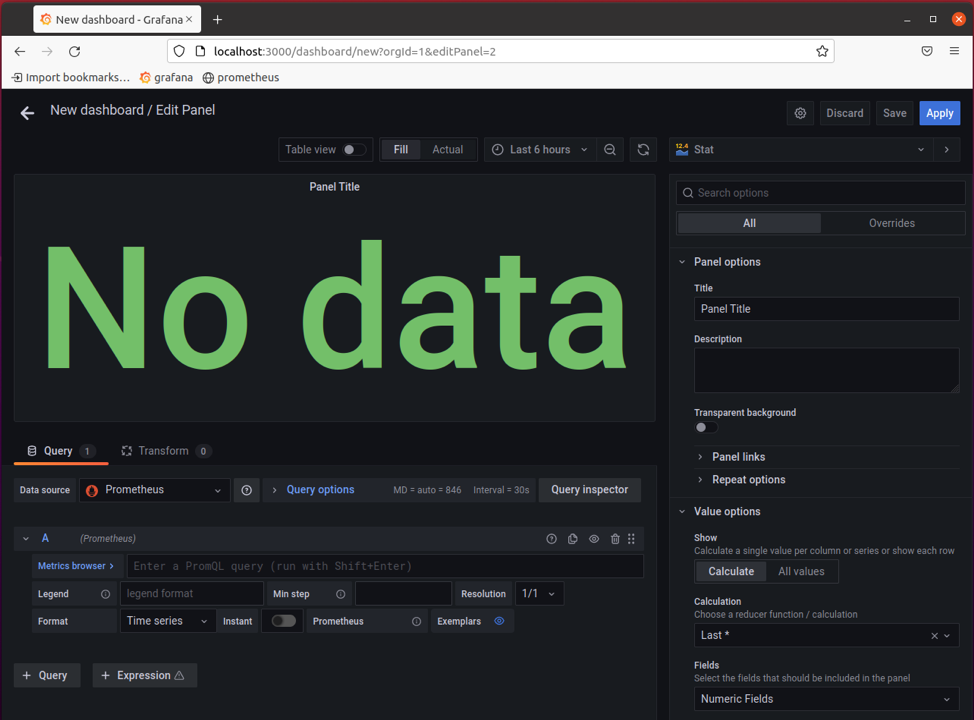
Stat visualization type should be selected.
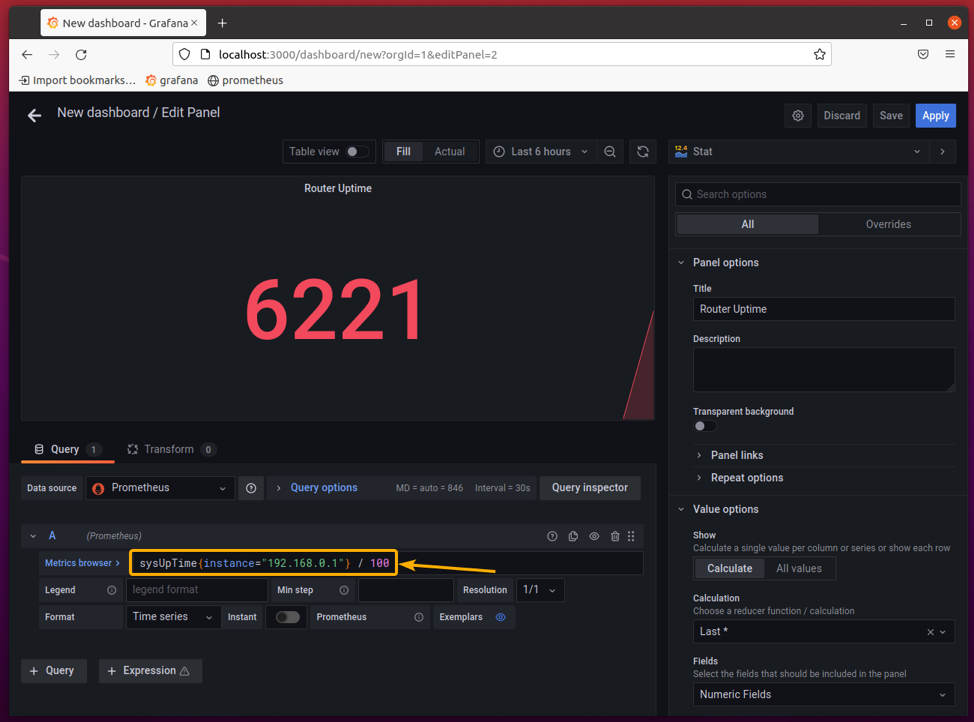
Change the panel title to Router Uptime from the Panel options section as marked in the screenshot below.
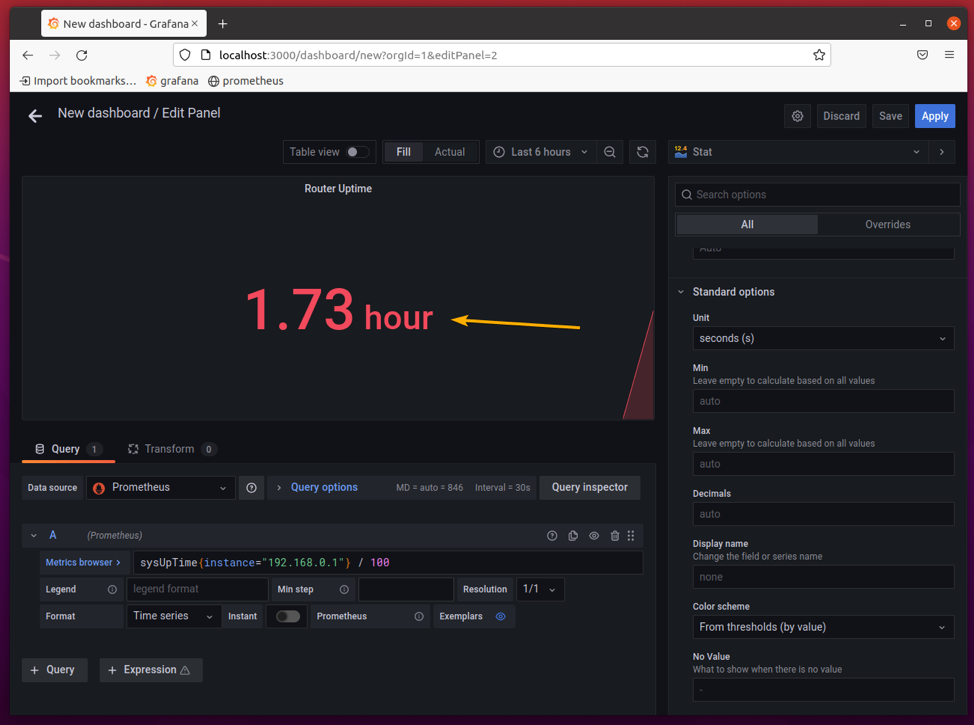
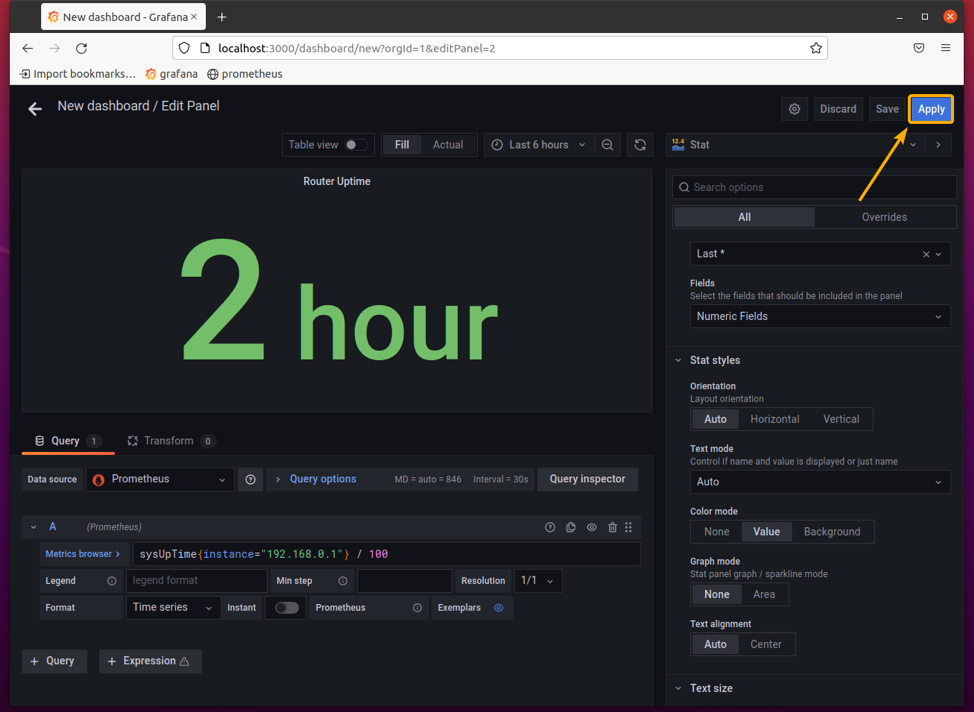
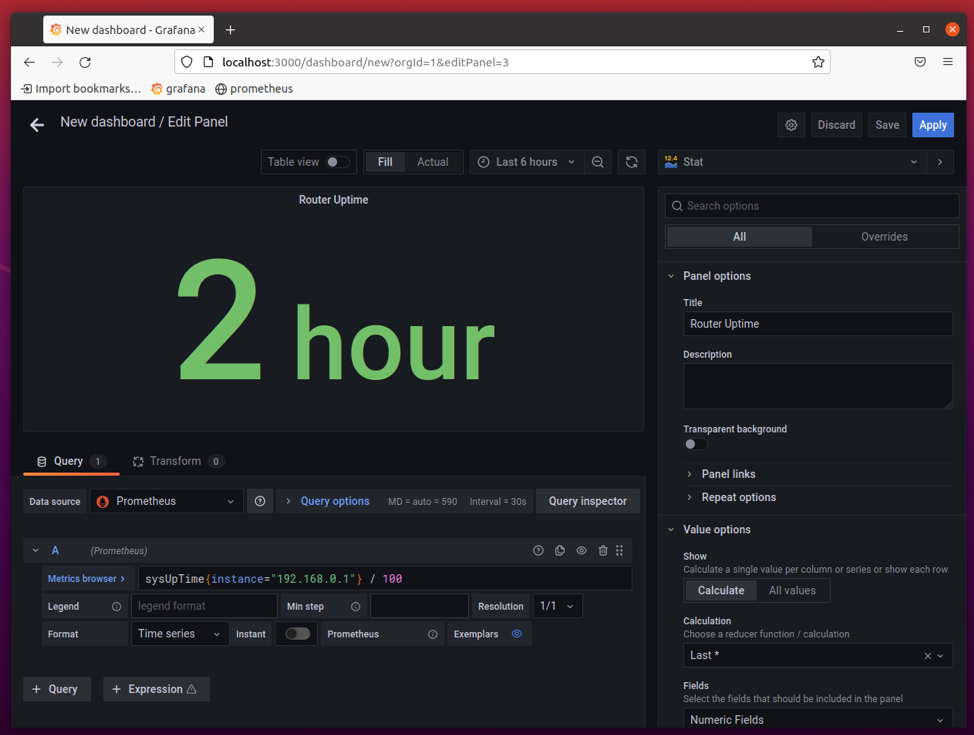
In the Metrics browser, type in the Prometheus query sysUpTime{instance=”192.168.0.1″} / 100. Here, 192.168.0.1 is the IP address of my home router. It may be different for you. So, make sure to replace it with yours from now on.
The system uptime should be displayed in the panel preview window in seconds, as shown in the screenshot below.
NOTE: If you’re monitoring multiple network devices with snmp_exporter, Prometheus, and Grafana, make sure to include the instance filter in each of the Prometheus queries to make sure that you’re monitoring the correct network device.
For example,
IfOutOctets{instance="192.168.0.1"}
IfInOctets{instance="192.168.0.1"}
In this article, I will be monitoring my home router only. So, I will not be using the instance filter on each of the Prometheus queries.
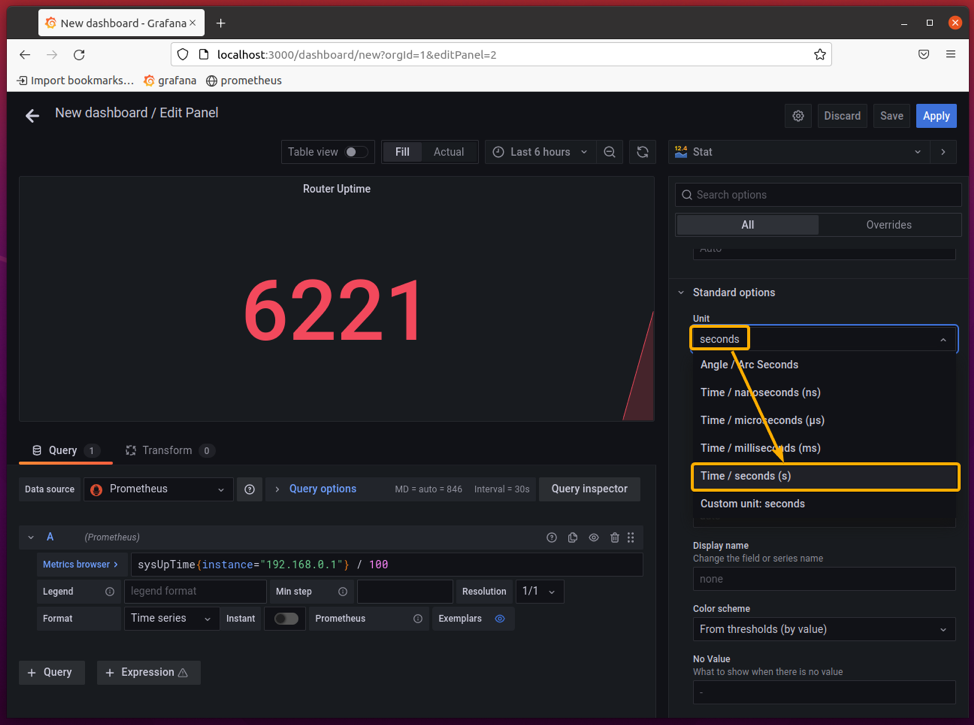
Set the unit Time / seconds (s) from the Standard Options > Unit section as marked in the screenshot below.
The uptime should be displayed in a human-friendly format.
To eliminate the decimal digits, set Decimals to 0 from the Standard Options section as marked in the screenshot below. The uptime should look much better now.
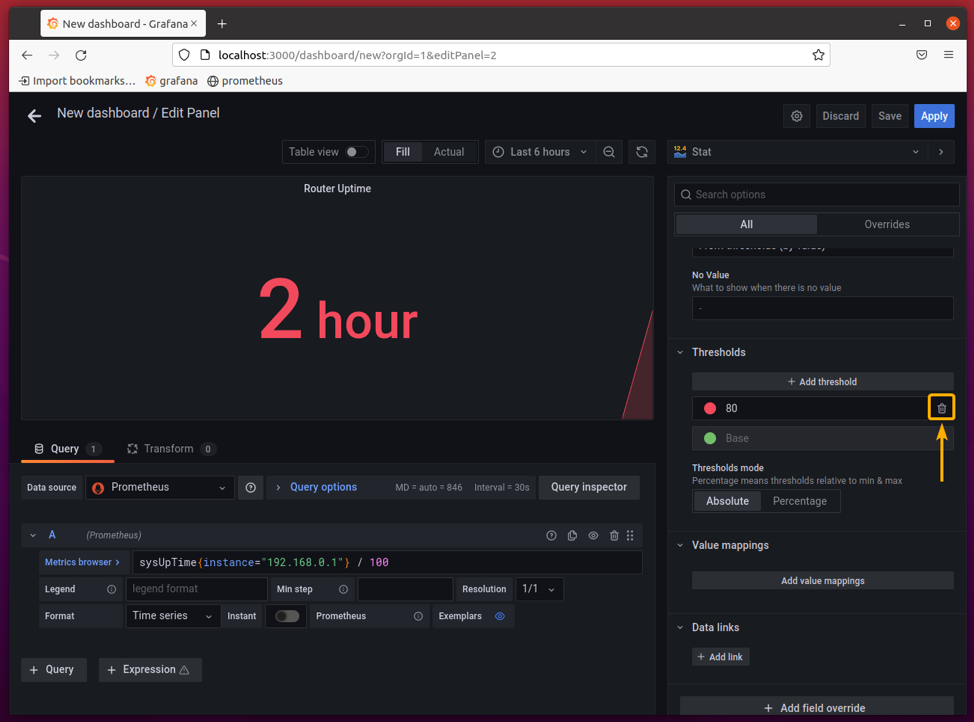
You also don’t need a threshold value for the uptime data. So, remove the threshold from the Thresholds section as marked in the screenshot below.
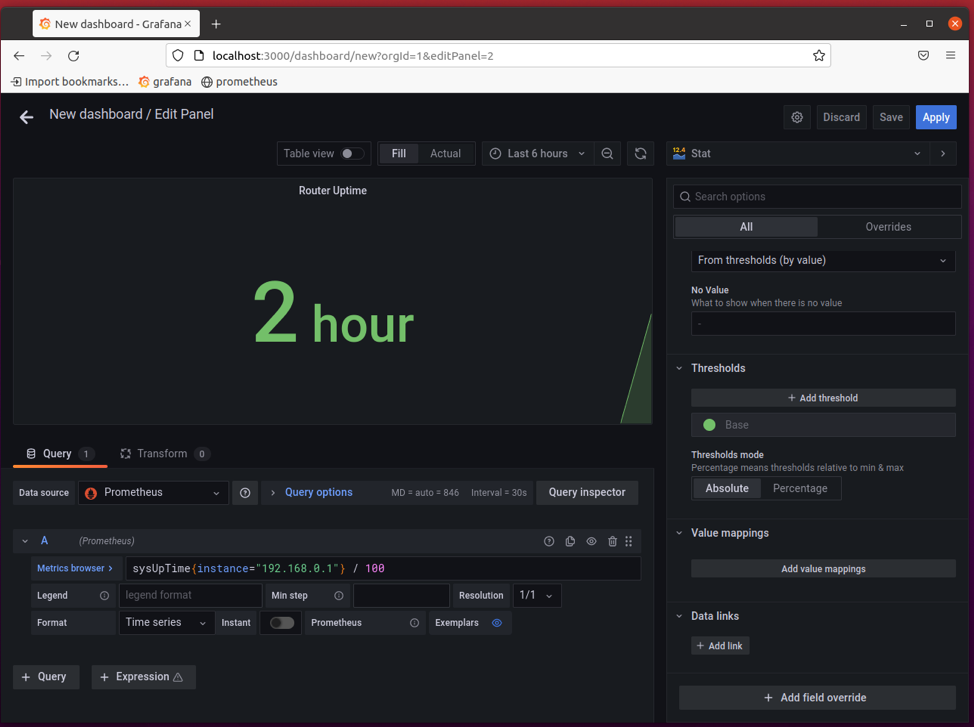
The threshold should be removed.
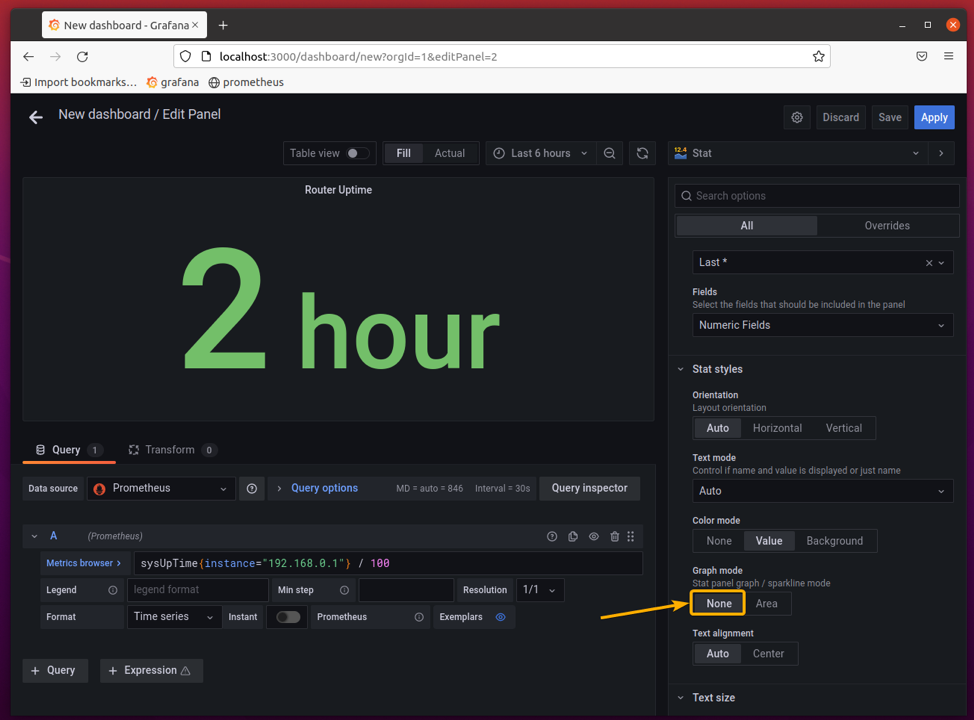
The uptime is a counter, and it keeps increasing. A graph of the uptime in the background of the panel does not make any sense. So, set Graph mode to None from the Stat styles section as marked in the screenshot below to remove the graph from the background.
Once you’re happy with the results, click on Apply to add the panel to the Dashboard.
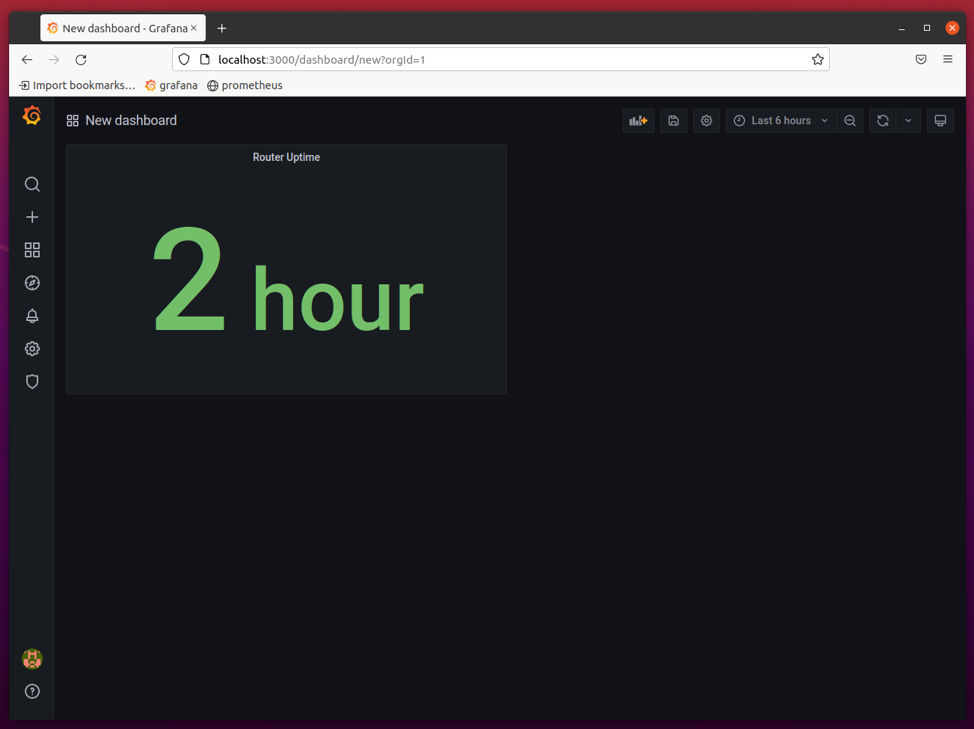
The Router Uptime panel should be added to the Dashboard, as shown in the screenshot below.
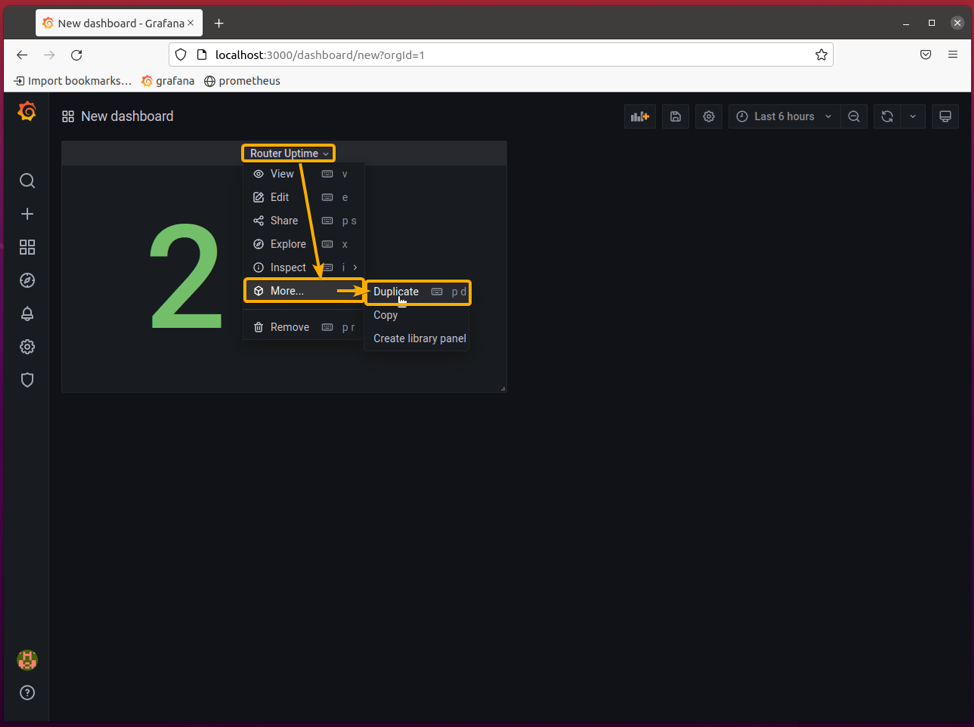
The panel that displays the total downloaded data will be a Stat as well and will be almost like the Router Uptime panel. So, instead of creating a new panel, let’s duplicate the existing Router Uptime panel. This will save you a lot of time.
To duplicate the existing Router Uptime panel, click on the Router Uptime panel’s dropdown menu and click on More… > Duplicate as marked on the screenshot below.
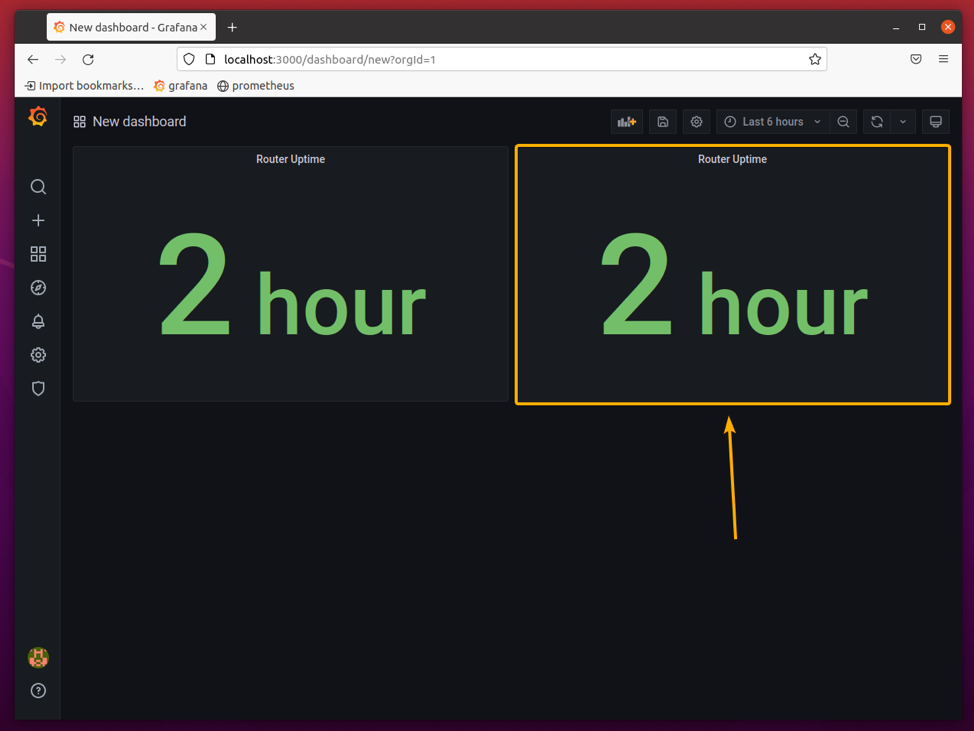
The Router Uptime panel should be duplicated, as you can see in the screenshot below.
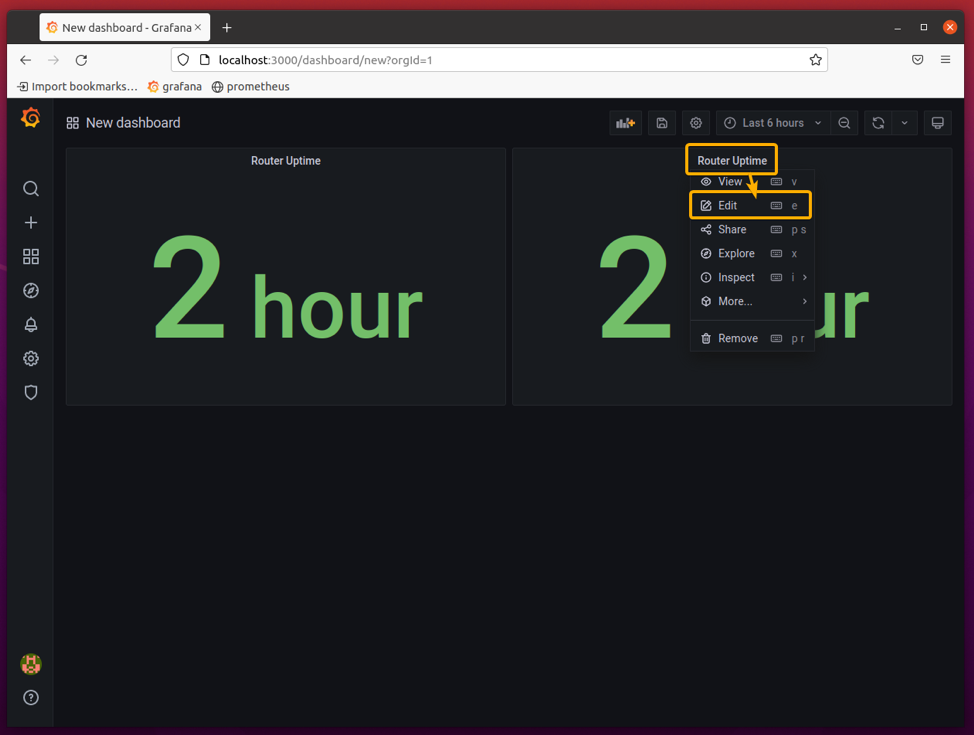
To edit the cloned Router Uptime panel, click on Router Uptime > Edit as marked in the screenshot below.
The cloned Router Uptime panel should be opened with the Grafana panel editor.
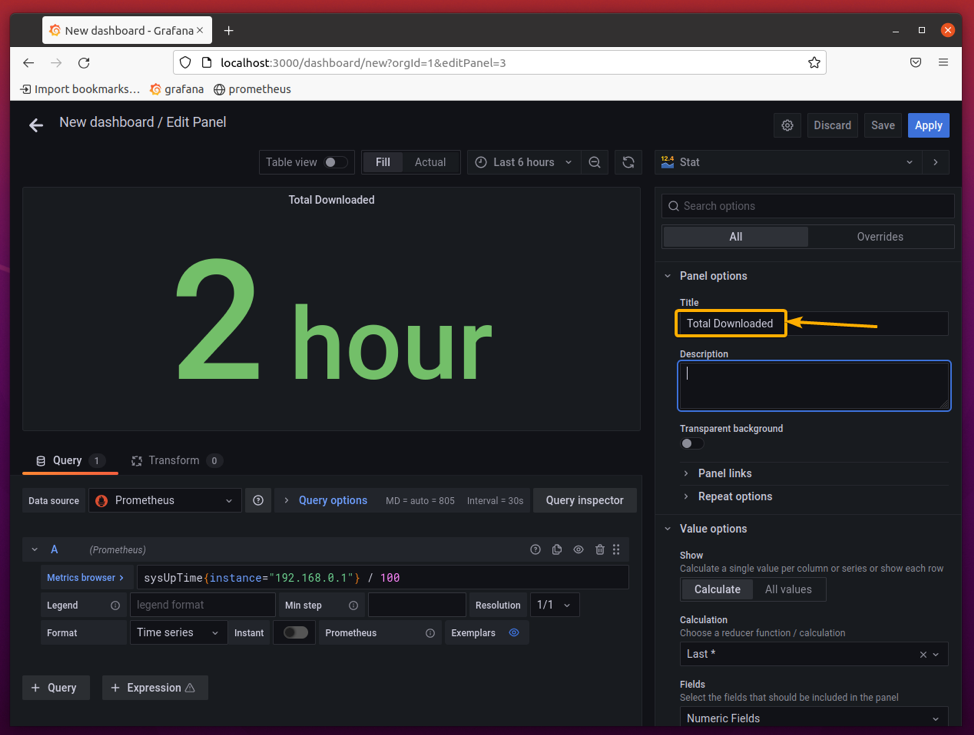
Change the title of the panel to Total Downloaded, as marked in the screenshot below.
A router has many network interfaces. You will have to pick the correct network interface from these to monitor the upload and download metrics of the router correctly.
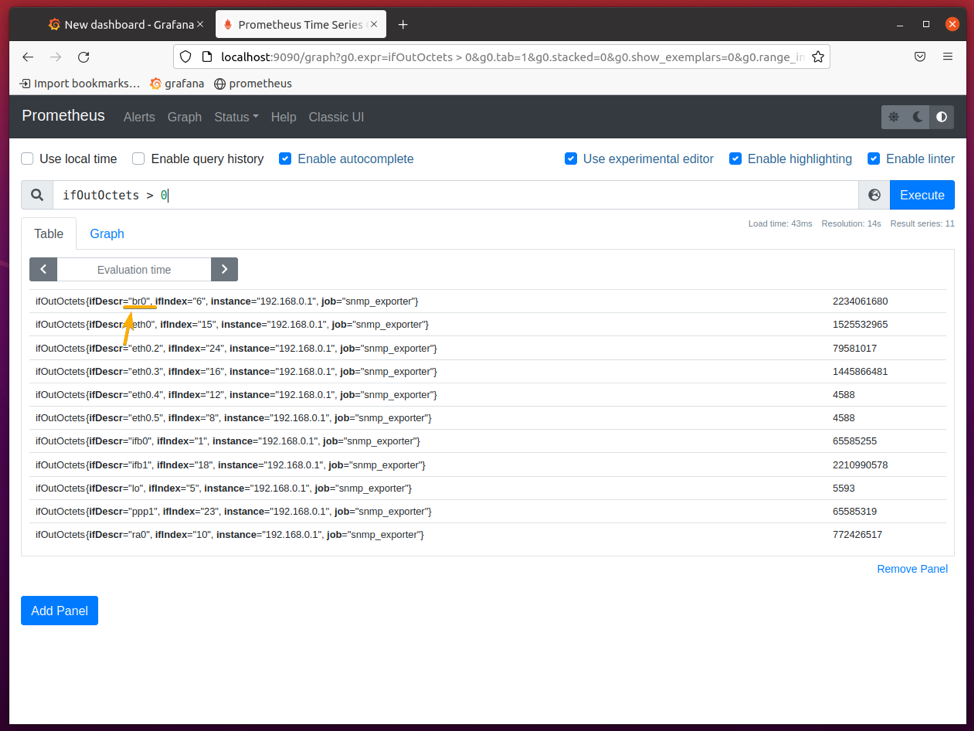
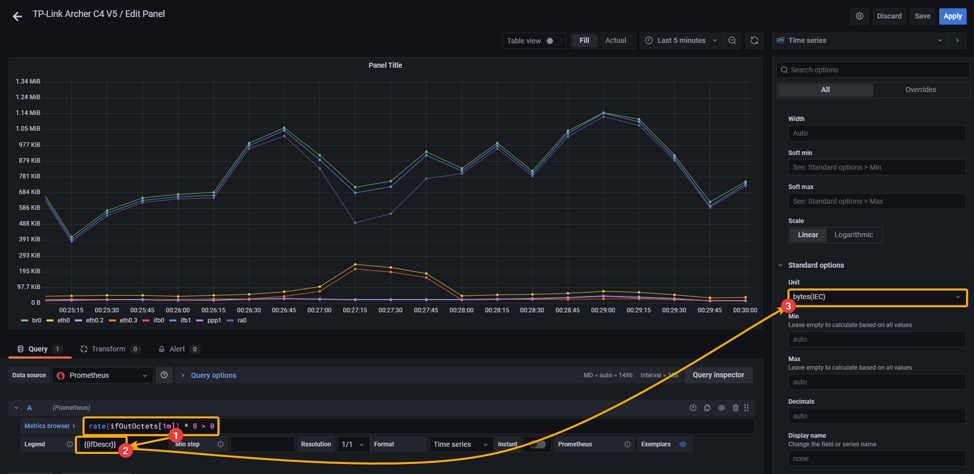
To find out the network interfaces available on your router that are generating some sort of network traffic, run the Prometheus query ifOutOctets > 0. The network interfaces that are generating some sort of network traffic should be listed, as you can see in the screenshot below.
Here, eth0, eth0.1, eth0.2, and so on may be used to monitor the individual LAN port traffics.
The ppp0, ppp1, and so on may be used to monitor the external/internet network traffic.
The br0 is a bridged network interface. It may bridge a few of the network interfaces together, and you may be able to use it to monitor the network traffic of the bridged network interfaces altogether.
The ra0 interface may be the wireless radio (Wi-Fi) network interface of your router, and you may be able to use it to monitor the wireless traffic of your router.
In this article, I will monitor the br0 network interface, for example. Your case may differ, and you may monitor a different network interface.
The exact network interface that you need to monitor to get correct network statistics depends on your router. You may need to see how these values change over time to determine what network interface you need to monitor.
You may run the Prometheus query rate(ifOutOctets[1m] * 8) > 0 on an empty Grafana dashboard panel with the following settings and stream a YouTube video on your computer to get an idea of which network interface to monitor.
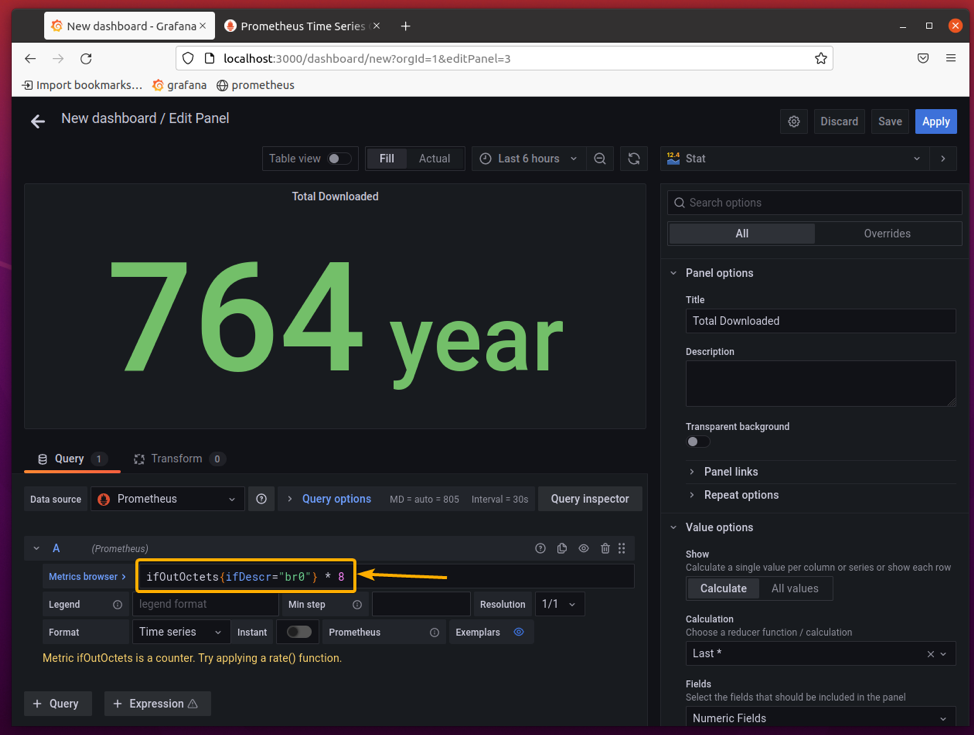
To monitor the total download traffic of the network interface br0, you can use the following Prometheus query.
Or,
NOTE: The default unit is bytes. If you multiply it by 8, you get bits.
If you want to display the data in KiB (Kibibytes), GiB (Gibibytes), TiB (Tebibytes), etc., units, use the first Prometheus query (multiply by 8).
If you want to display the data in KB (Kilobytes), GB ( Gigabytes), TB (Terabytes), etc., units, use the second Prometheus query (not multiplied by 8).
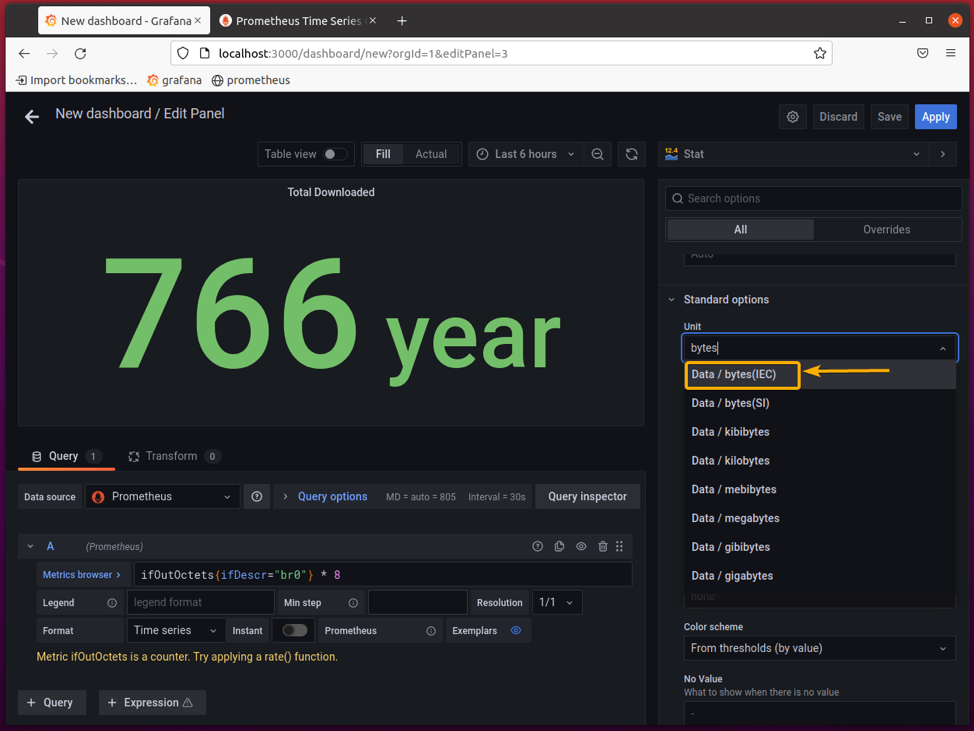
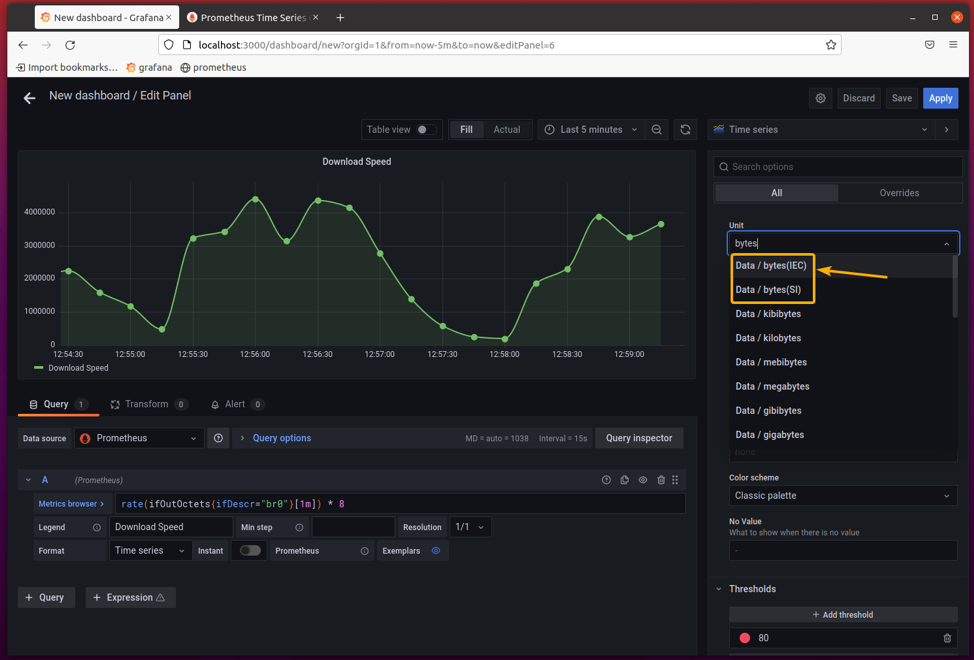
Select the unit Data / bytes(IEC) if you want to display the data in KiB, GiB, TiB, and so on.
Select the unit Data / bytes(SI) if you want to display the data in KB, GB, TB, and so on.
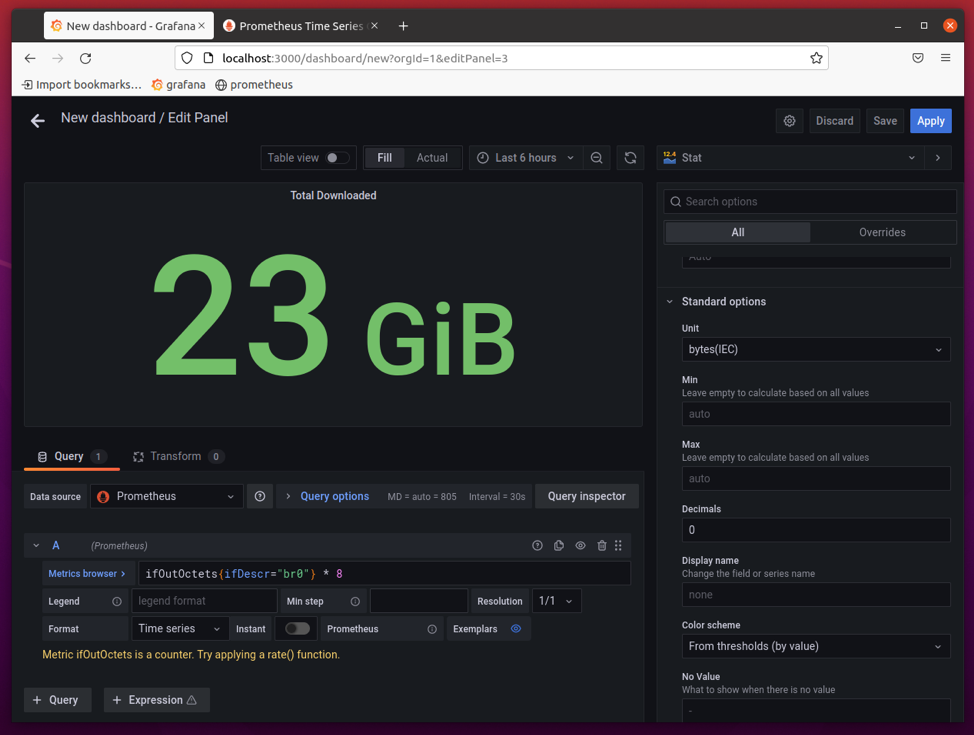
The total downloaded data of the br0 interface should be displayed correctly, as you can see in the screenshot below.
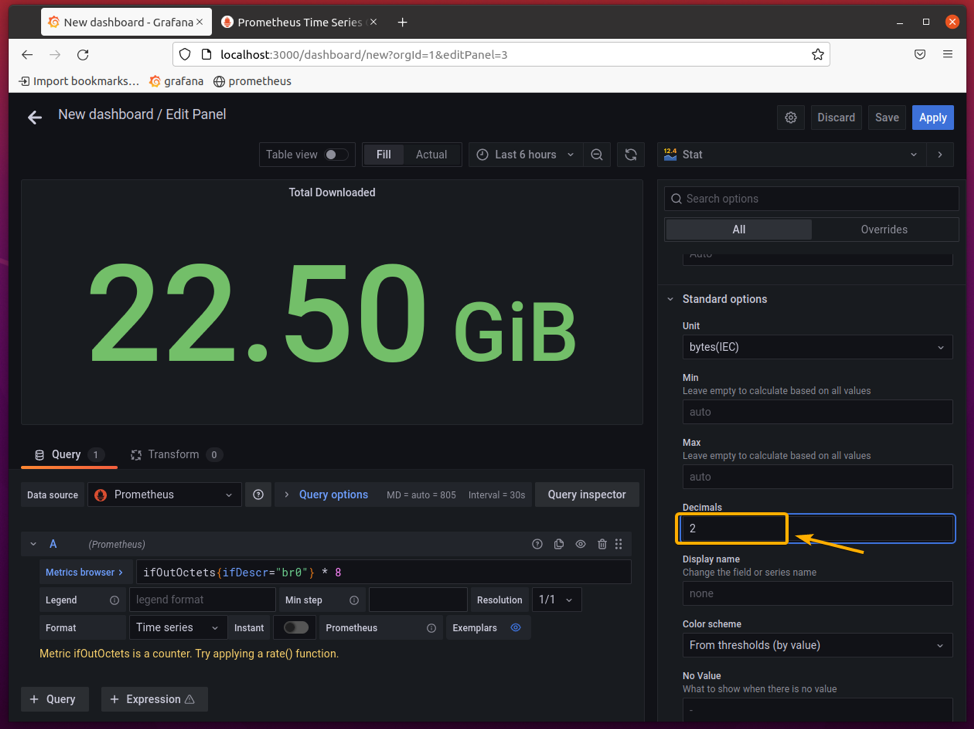
If you want to see 2 decimal places, set Decimals to 2 in the Standard options section, as shown below.
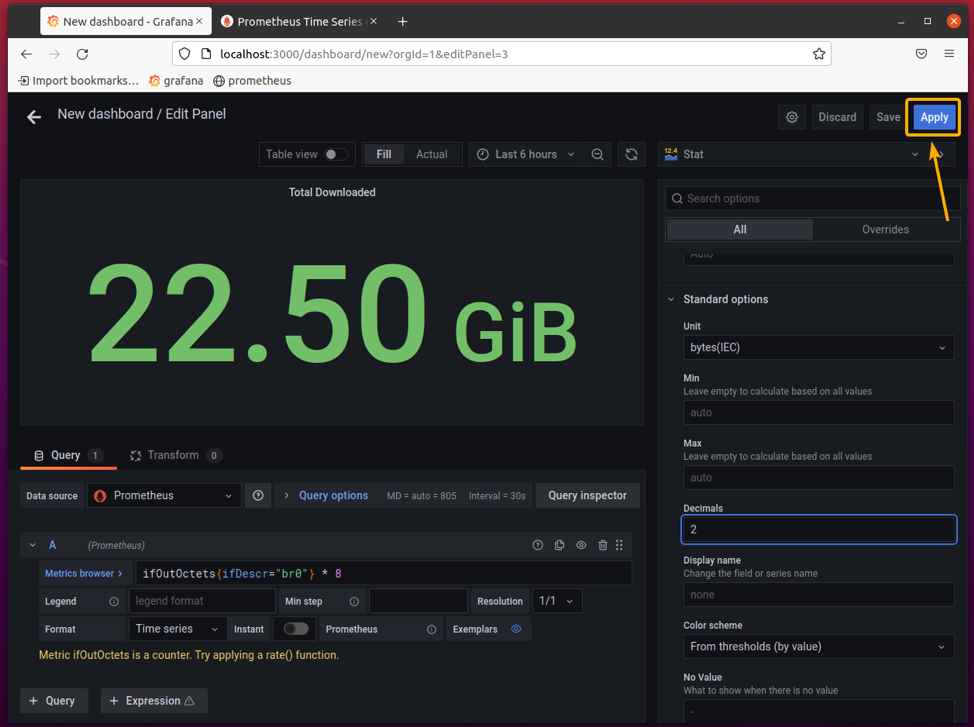
Once you’re happy with the results, click on Apply to add the panel to the dashboard.
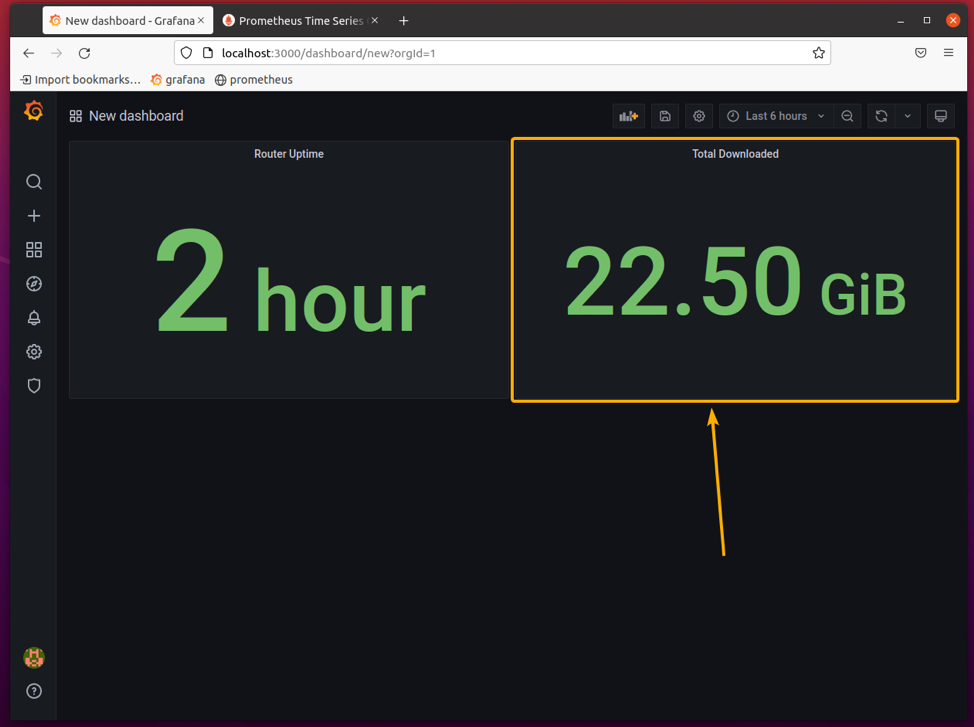
The Total Downloaded panel should be added to the Dashboard, as shown in the screenshot below.
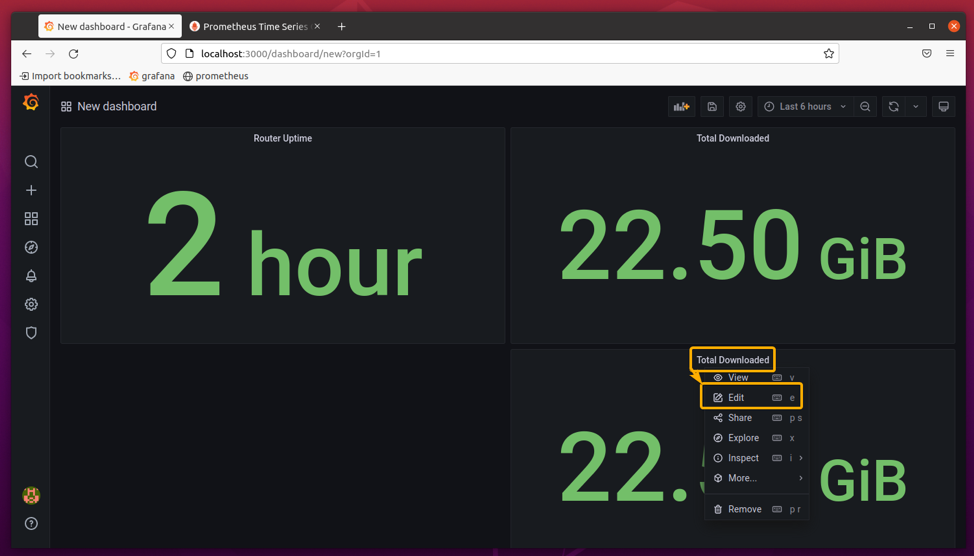
The Total Uploaded panel will be the same as the Total Downloaded panel. The only difference is that it will calculate total upload traffic instead. So, to make things easier, clone the Total Downloaded panel and edit the cloned Total Downloaded panel.
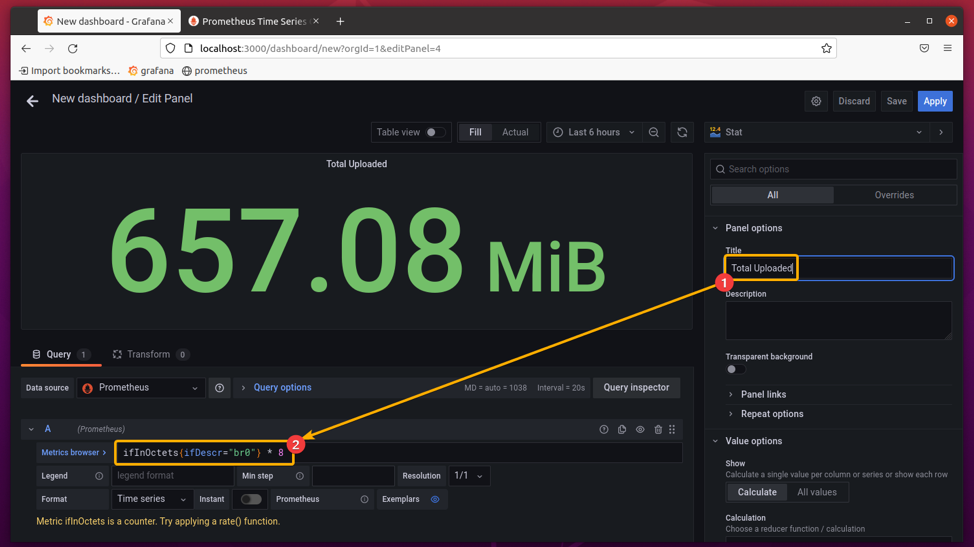
Change the Prometheus query from ifOutOctets to ifInOctets and set the panel title to Total Uploaded, as marked in the screenshot below.
The total upload traffic should be displayed correctly.
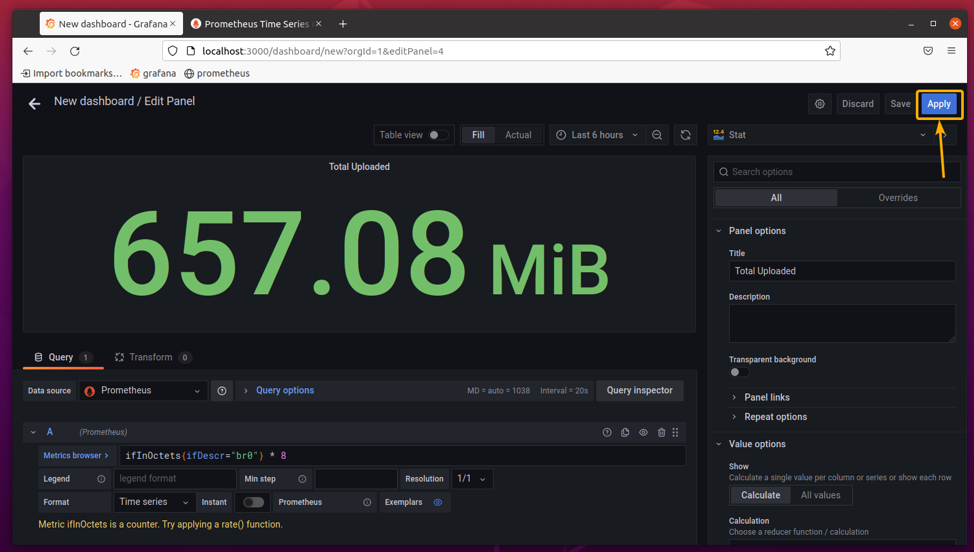
Once you’re happy with the results, click on Apply.
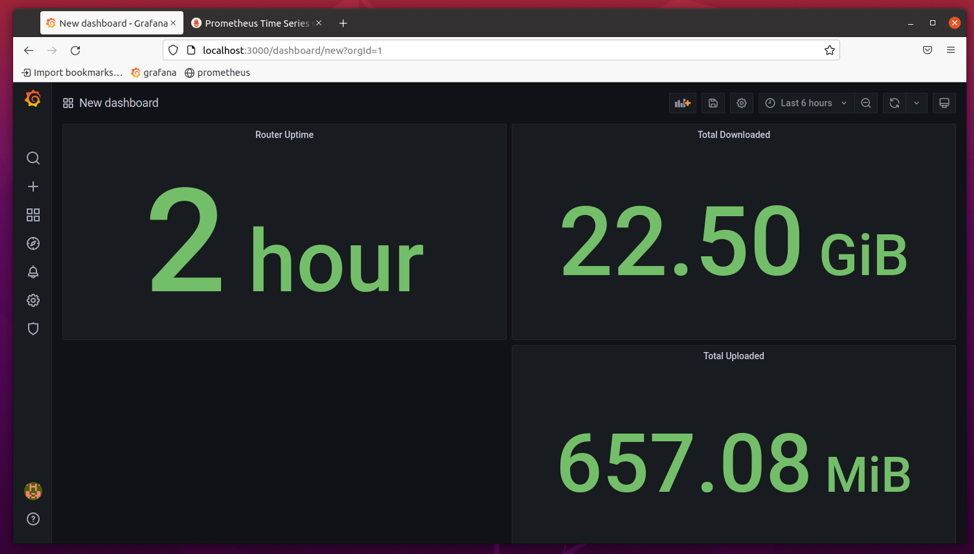
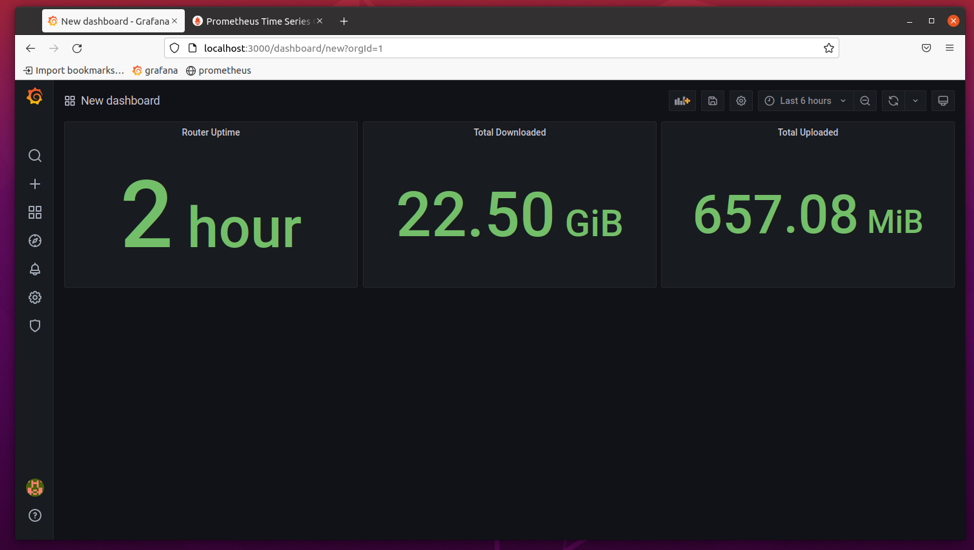
The Total Uploaded panel should be added to the Dashboard, as shown in the screenshot below.
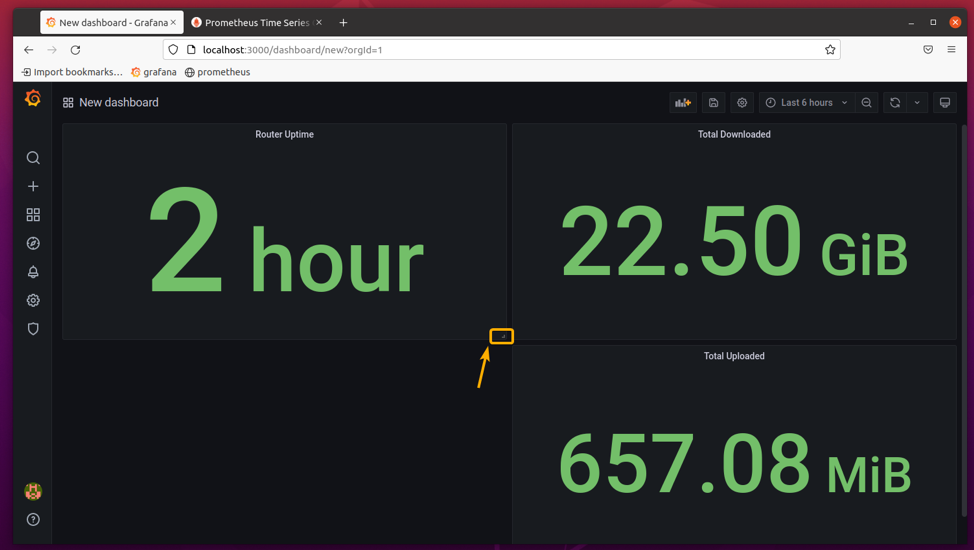
You can hover over to the bottom-right corner of any panels, press and hold the LMB (Left Mouse Button) and drag to resize the Dashboard panels.
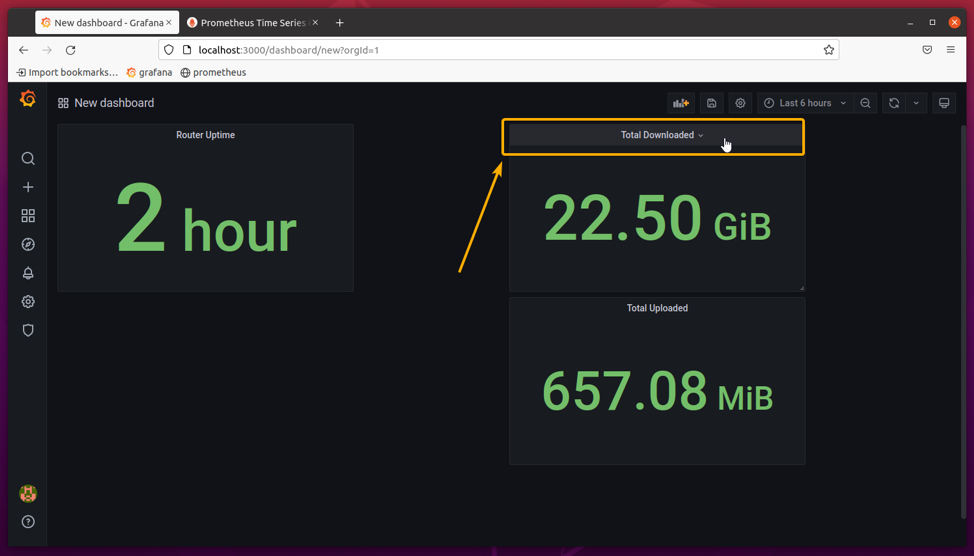
You can also hold and drag the panels by their panel title to align them anywhere on the Dashboard.
I have resized and aligned the Dashboard panels as follows.
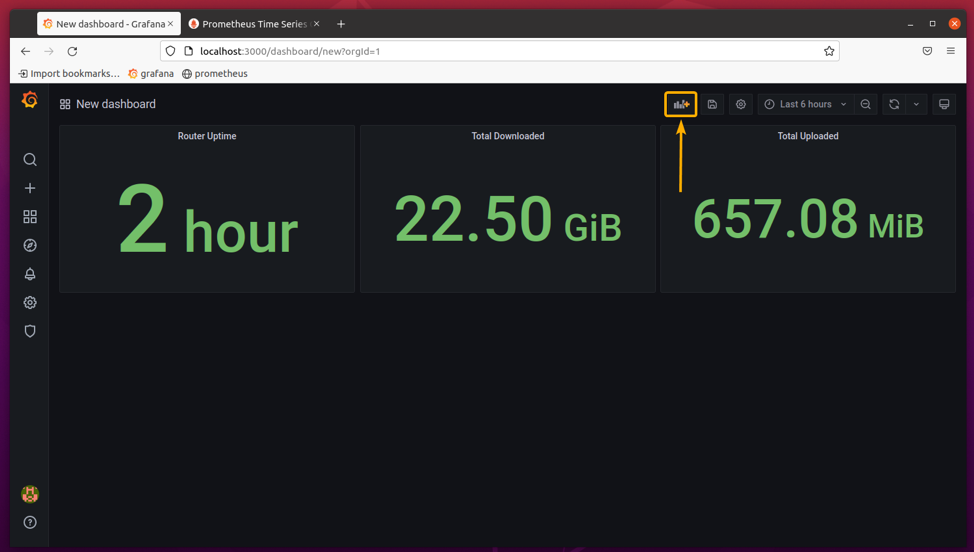
To monitor the network download speed, click on the add icon () to create a new panel on the Dashboard.
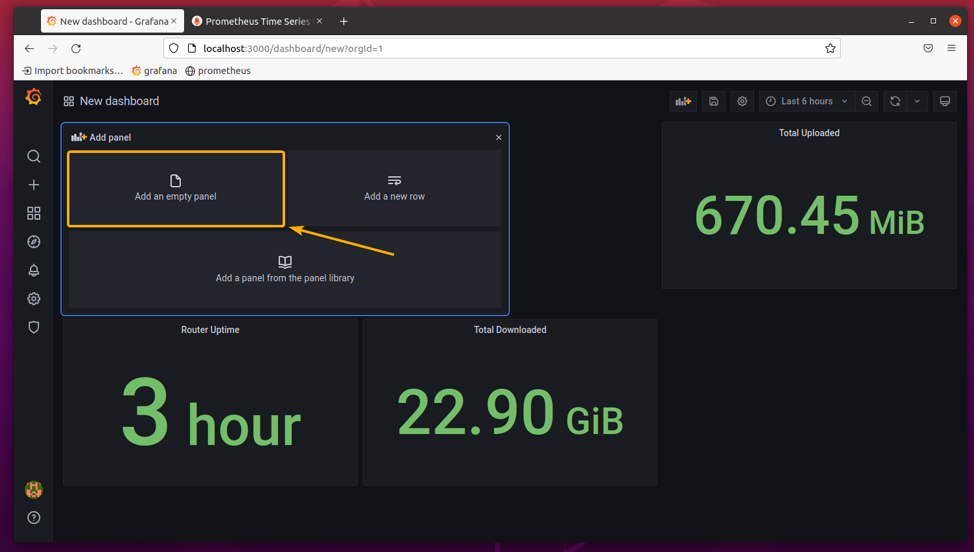
Click on Add an empty panel.
The Grafana panel editor should be opened.
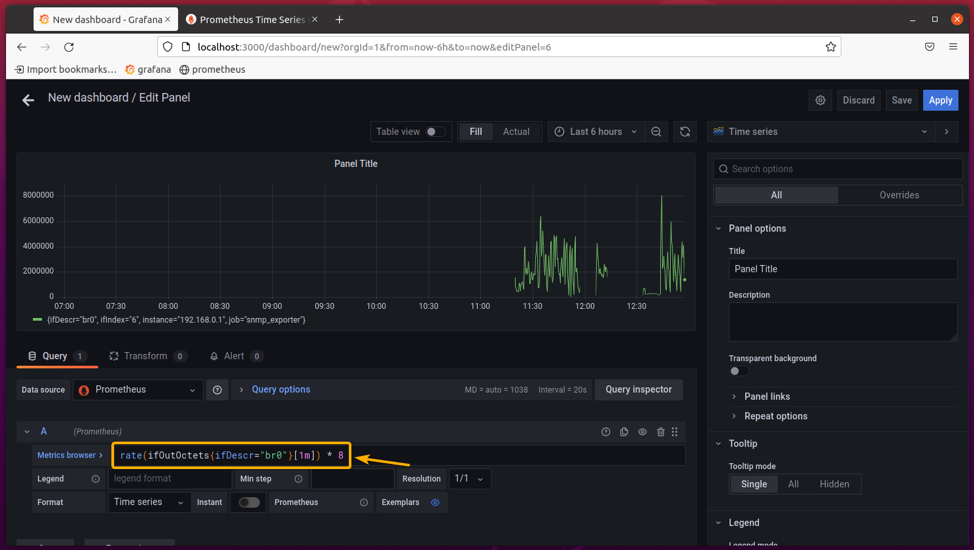
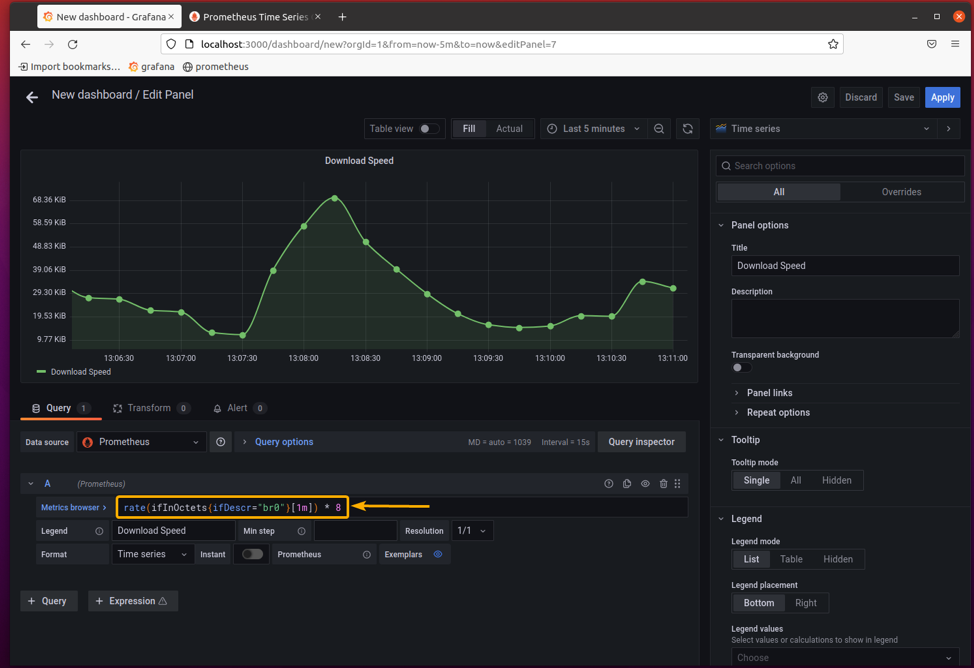
To monitor the download speed of the network interface br0, type in the following Prometheus query in the Metrics browser section.
Or,
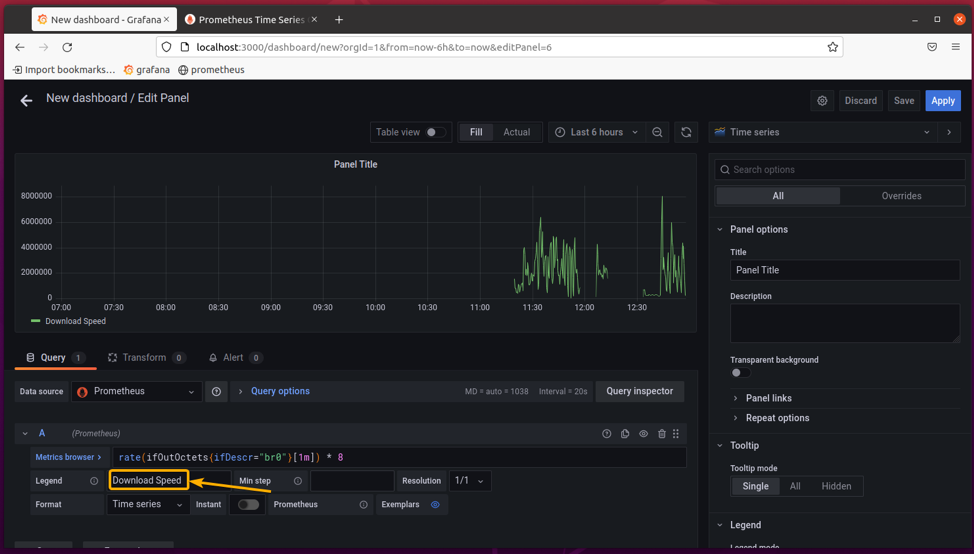
Set the Legend to Download Speed.
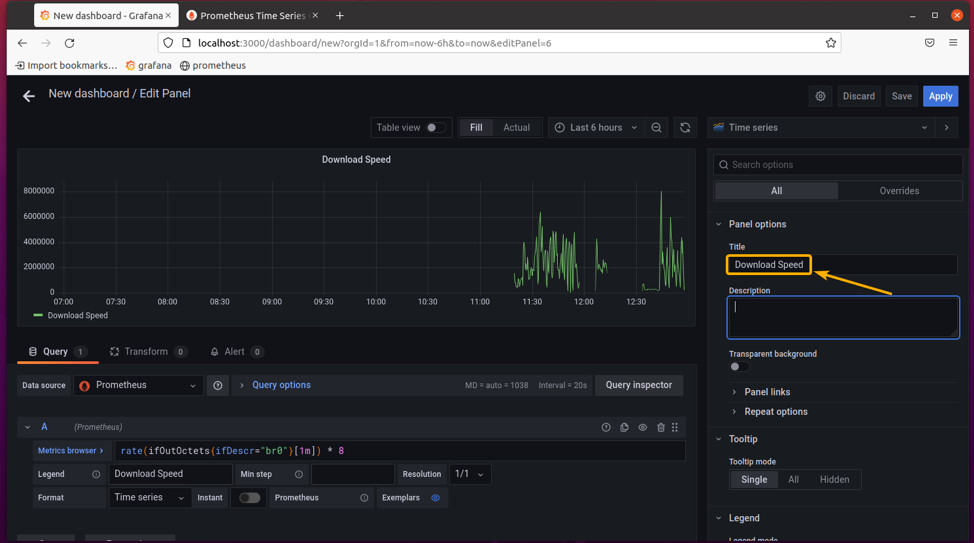
Set the panel title to Download Speed.
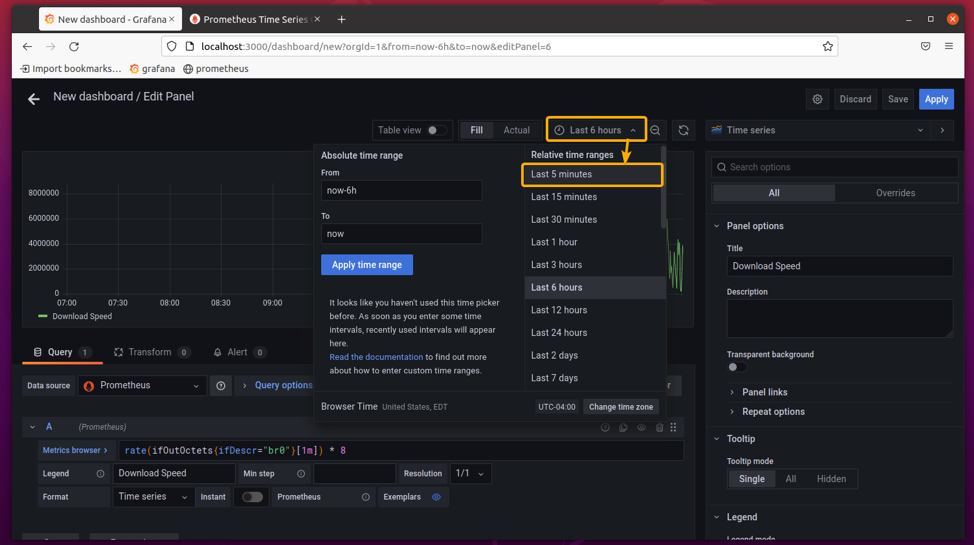
You can select a time range for the download speed graph from the dropdown menu, as shown below. I will select the Last 5 minutes so that it will display the network download speed of the br0 interface for the last 5 minutes.
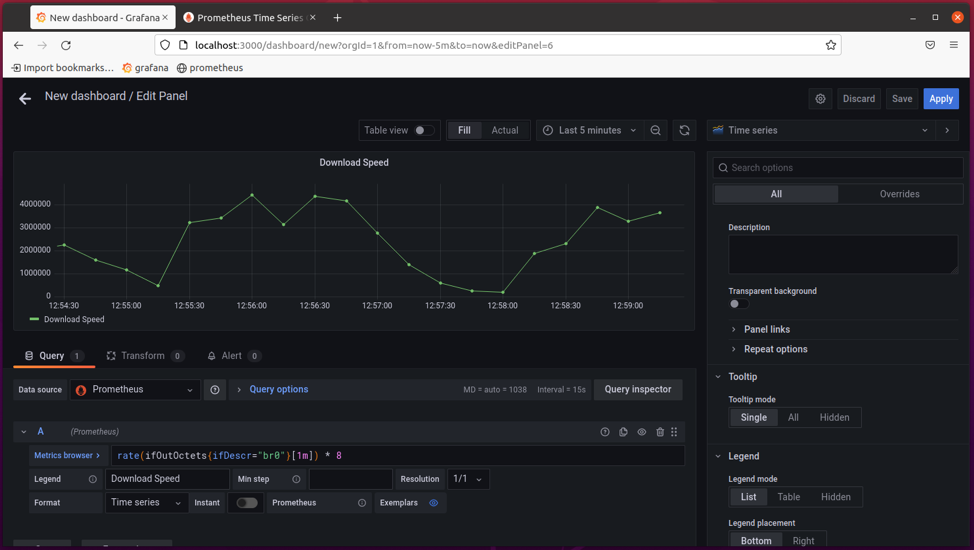
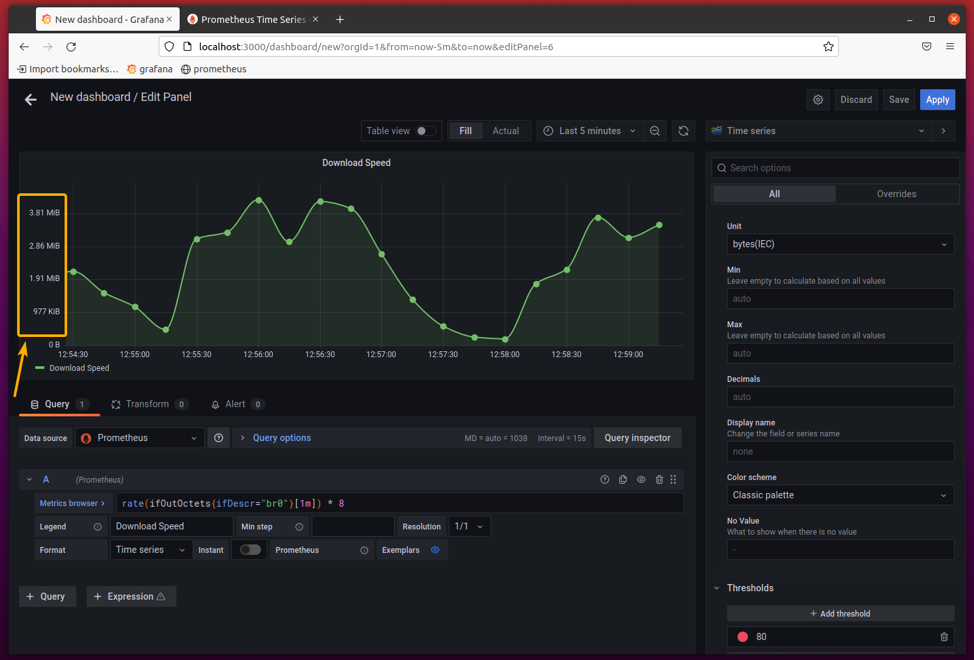
As you can see, the network download speed of the interface br0 is displayed for the last 5 minutes.
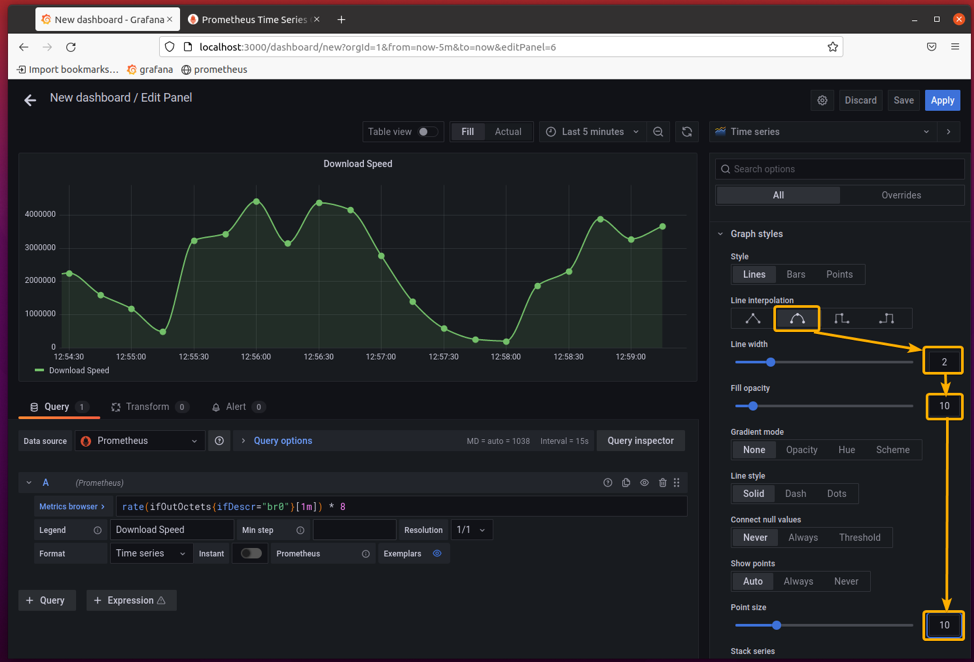
To make the graph look a little prettier, set Line interpolation to , set Line width to 2, Fill opacity to 10, and Point size to 10 from the Graph styles section as marked in the screenshot below.
Set the correct unit for the graph from the Unit section as marked in the screenshot below.
The correct unit should be displayed in the graph.
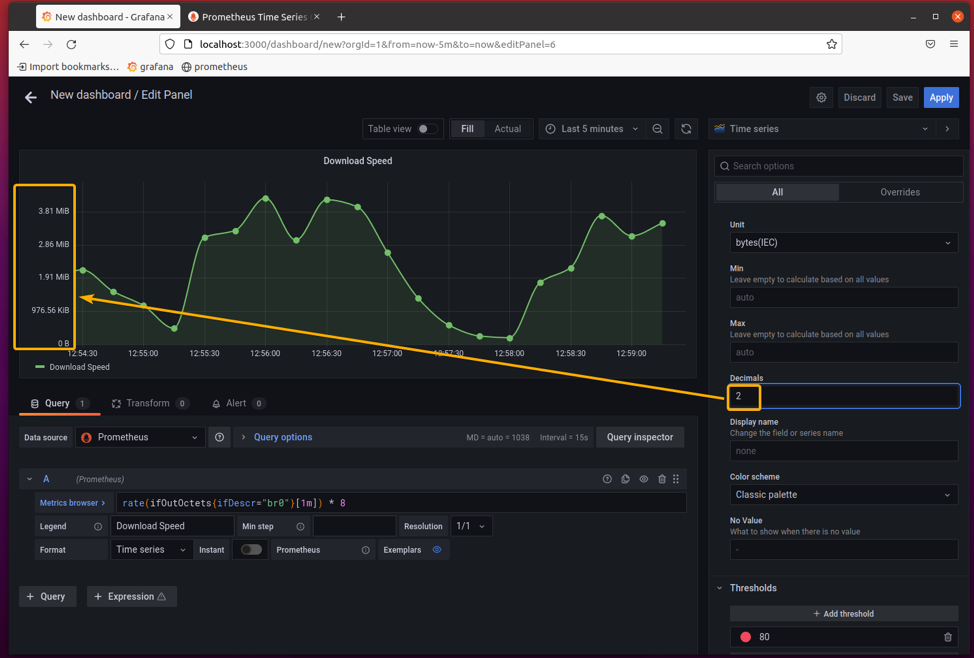
Set Decimals to 2. This will show only 2 decimal places for the Y-axis of the download speed graph.
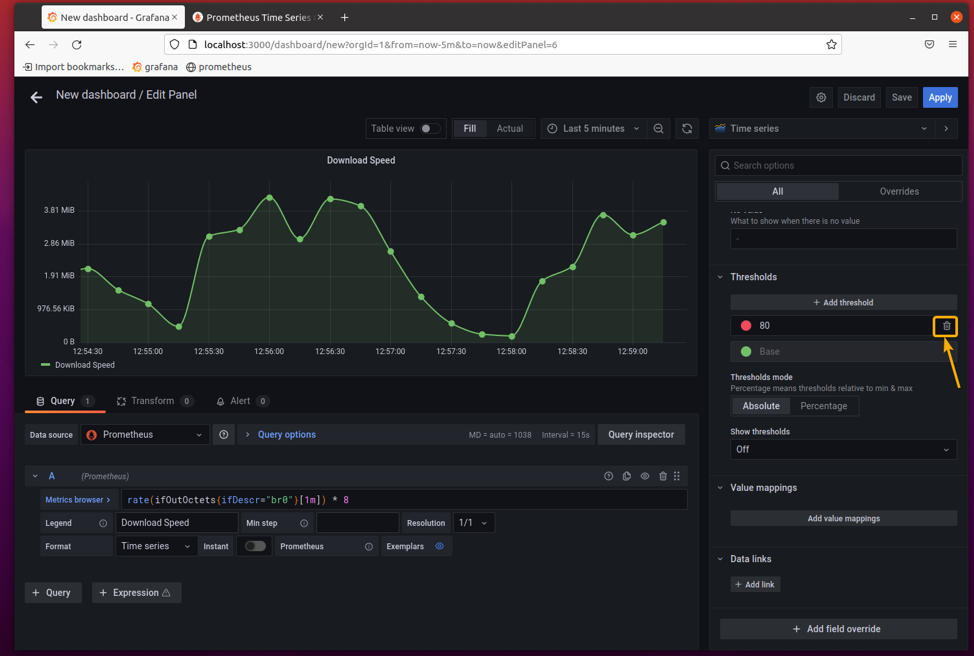
Remove the threshold as you don’t need it here.
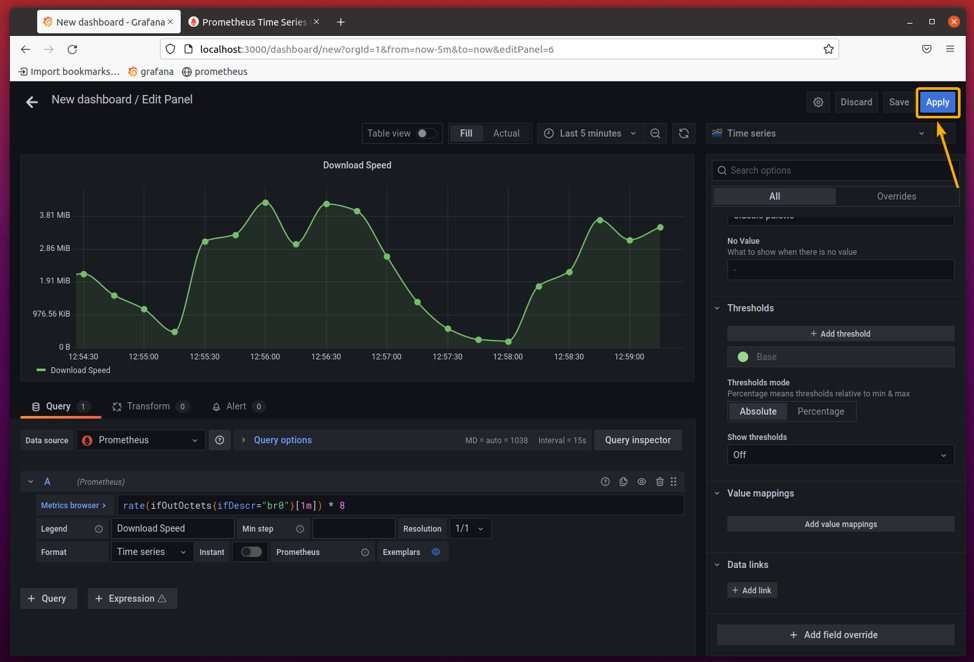
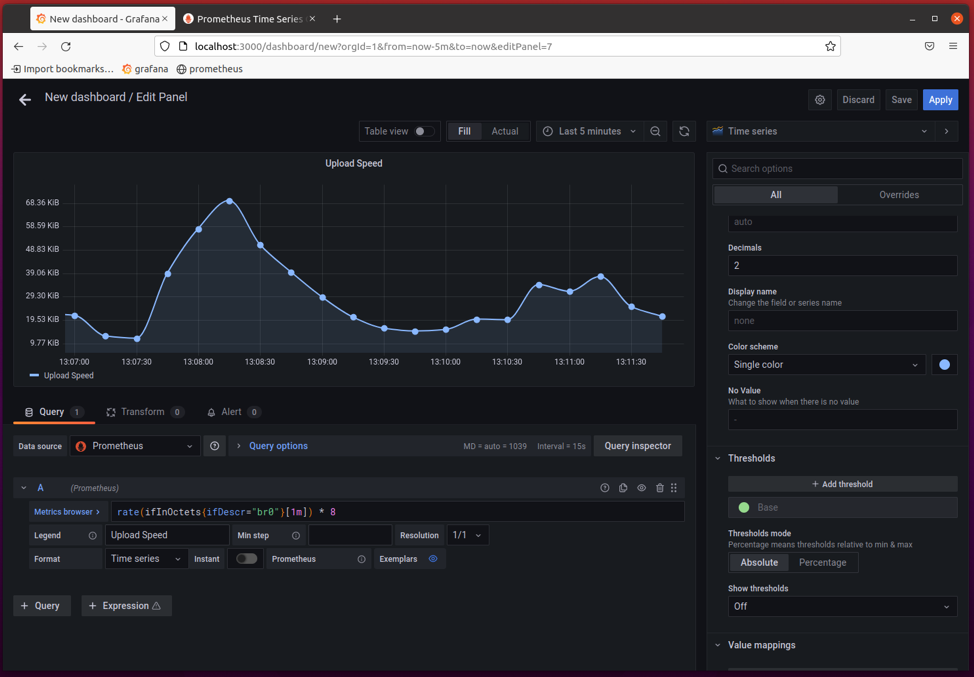
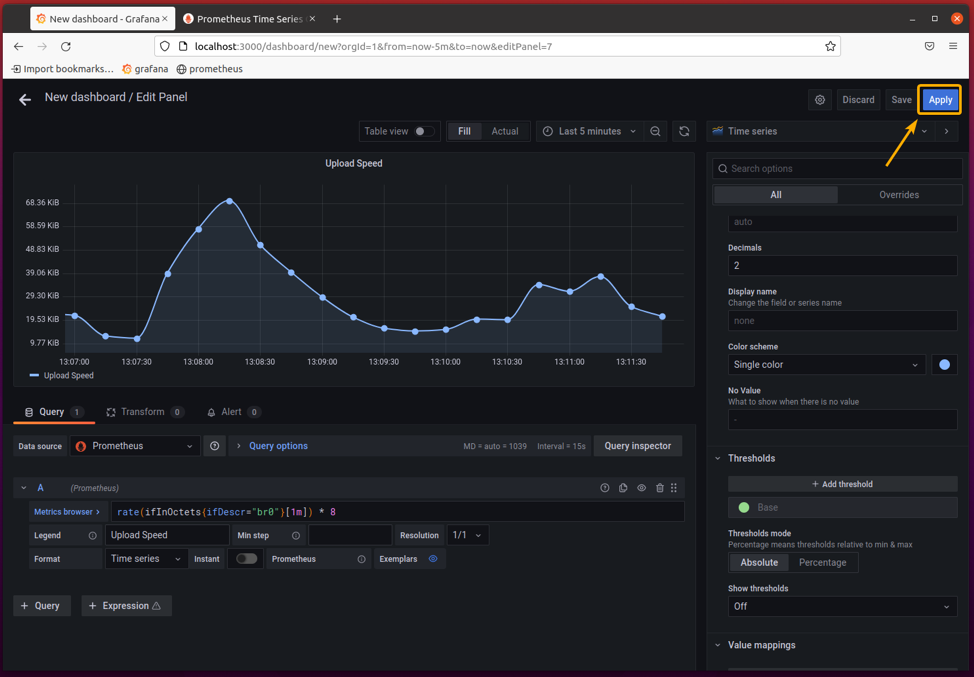
Once you’re happy with the results, click on Apply.
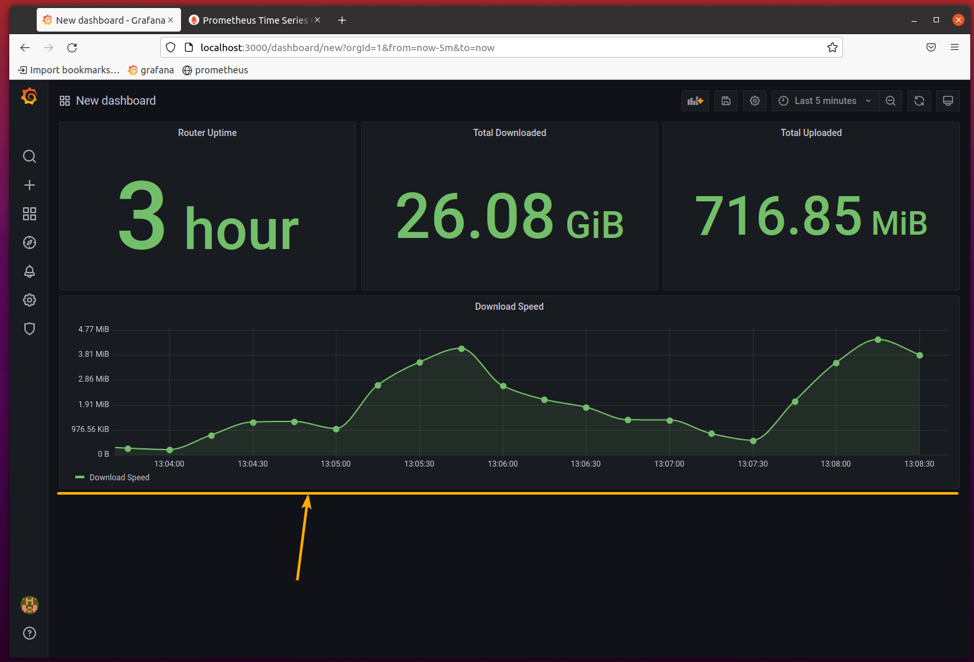
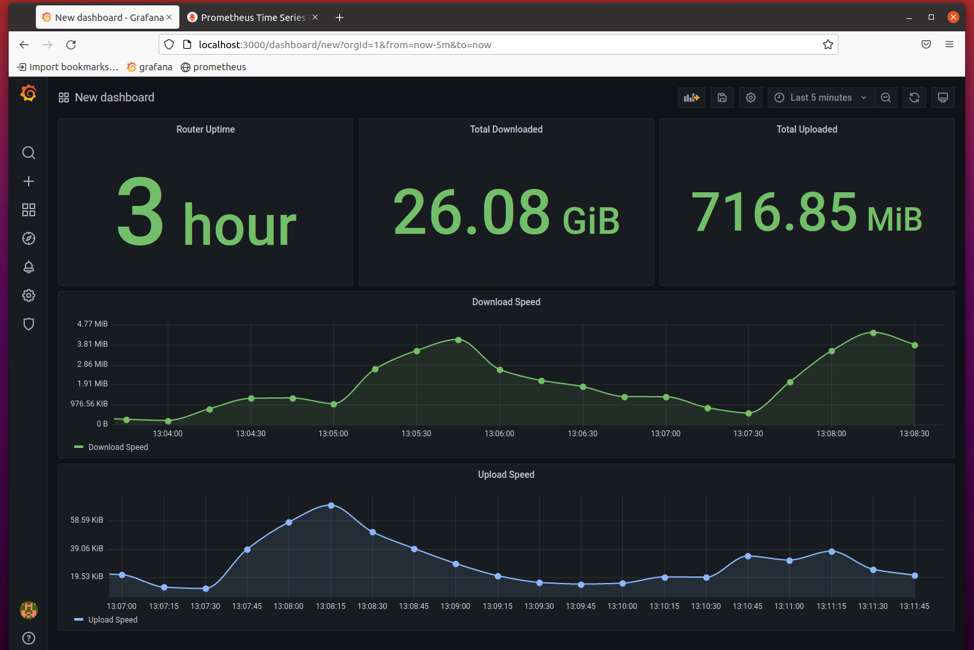
The Download Speed panel should be added to the Dashboard, as shown in the screenshot below.
Drag the Download Speed panel below all the other panels and resize it as you see fit.
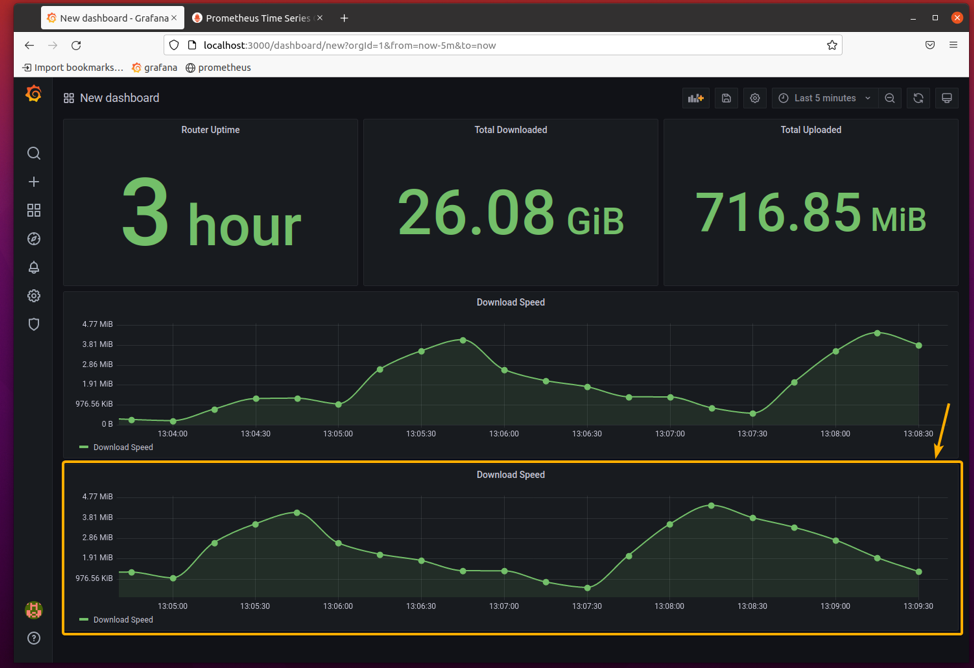
The Upload Speed panel will be the same as the Download Speed panel. So, duplicate the Download Speed panel and edit it as before to save time.
The duplicated Download Speed panel should be opened with the Grafana panel editor.
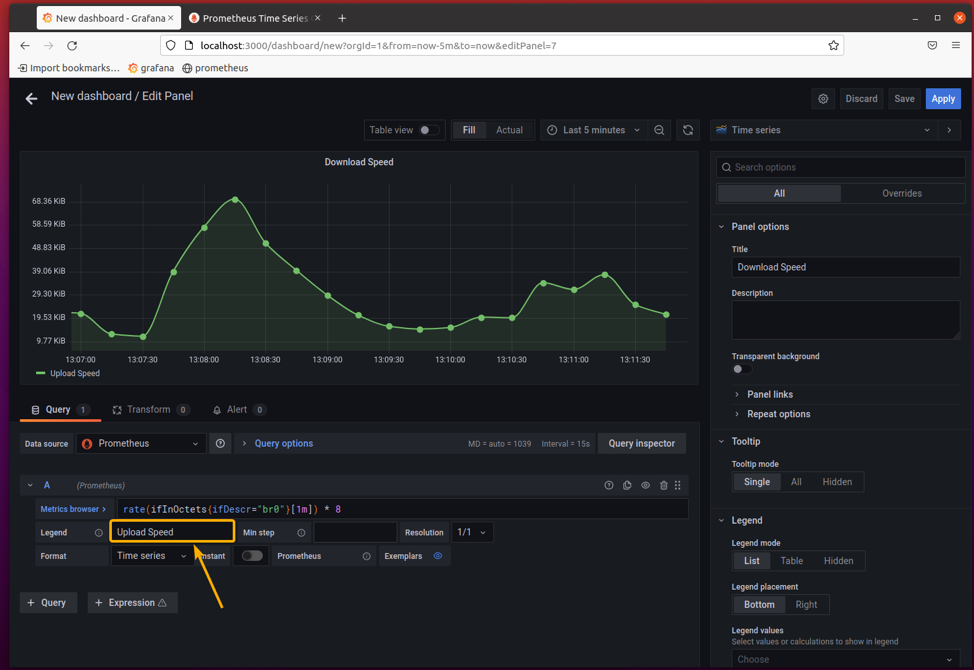
Change ifOutOctets to ifInOctets of the Prometheus query in the Metrics browser as marked in the screenshot below.
Change the Legend to Upload Speed.
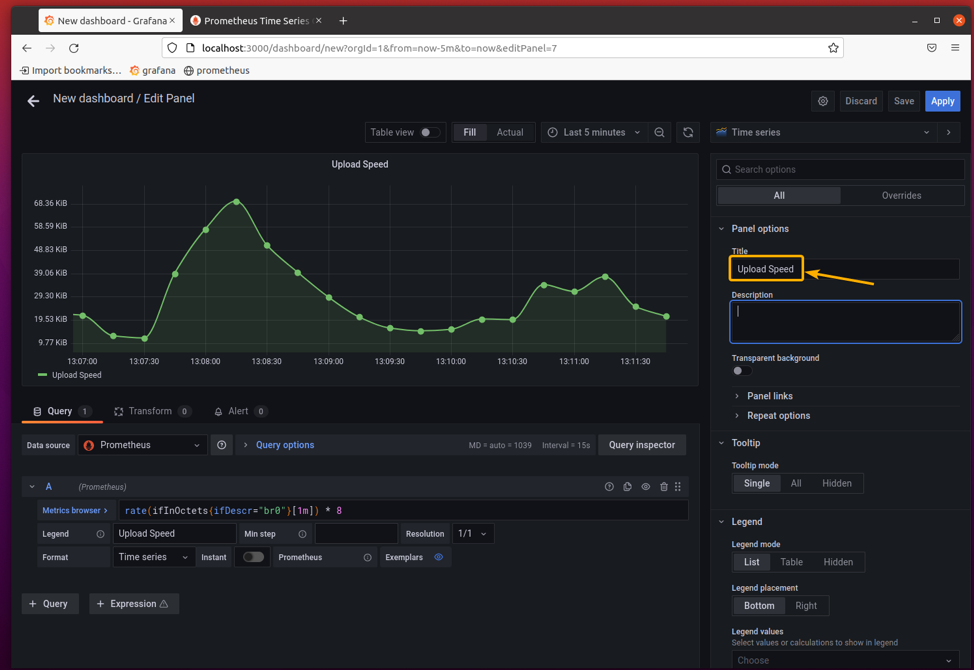
Change the panel title to Upload Speed.
To make the graph a little interesting, you may also change the graph color.
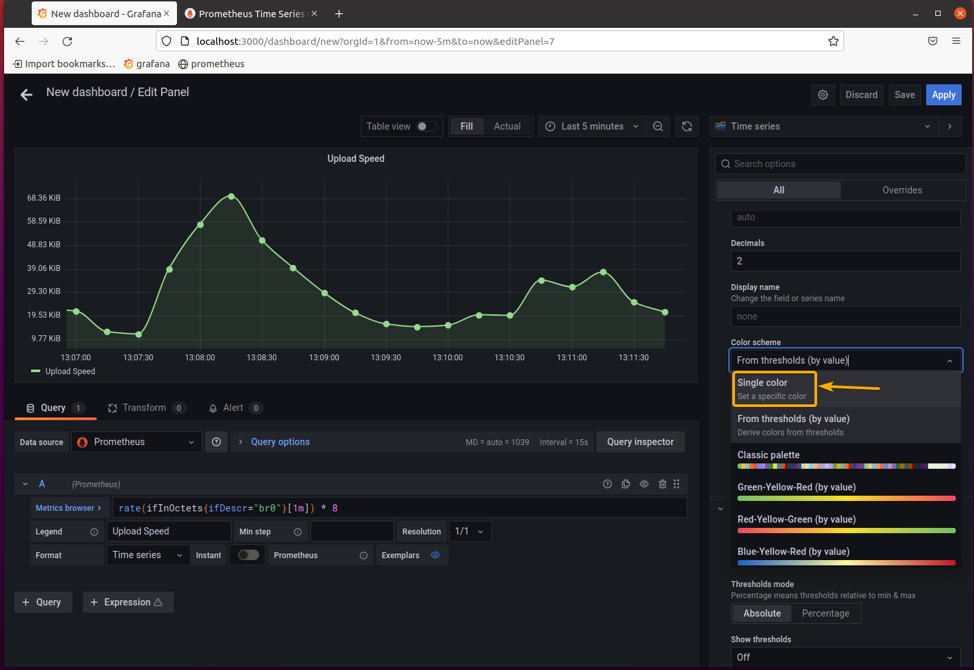
To do that, select Single color from the Color scheme section as marked in the screenshot below.
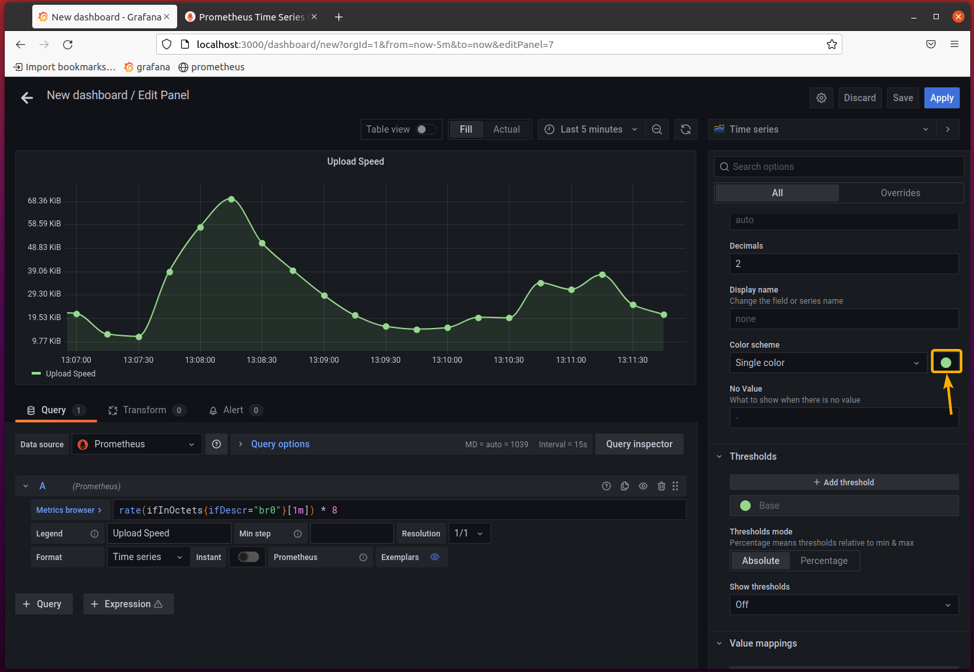
Click on the color to select a new color for the graph.
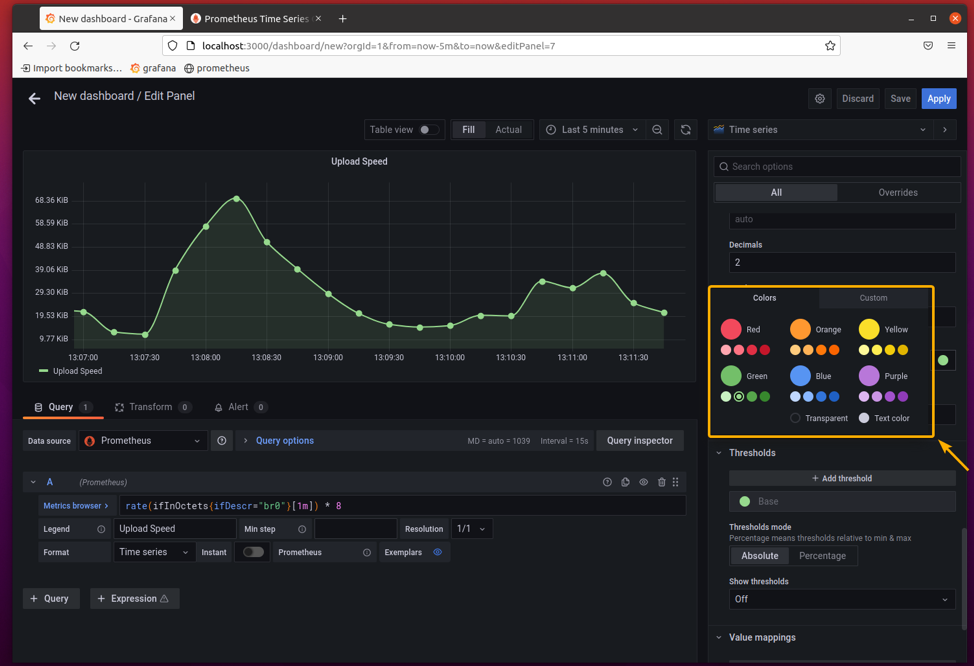
Select the color you like from the color picker as marked in the screenshot below.
The upload speed graph looks much better.
Once you’re happy with the results, click on Apply.
The Upload Speed panel should be added to the Dashboard, as shown in the screenshot below.
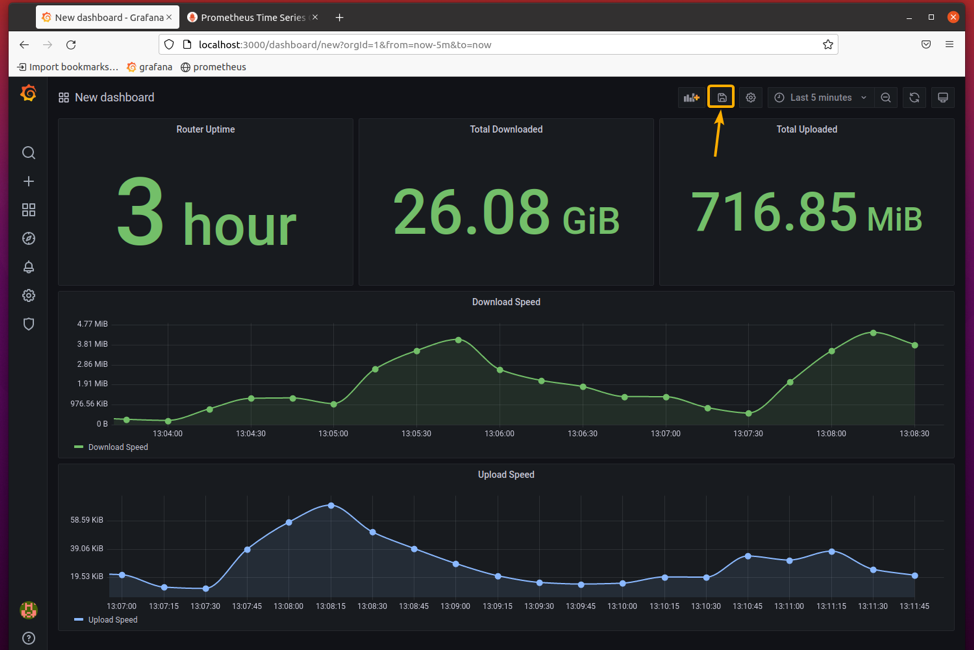
Now, click on the save icon as marked in the screenshot below to save the Dashboard.
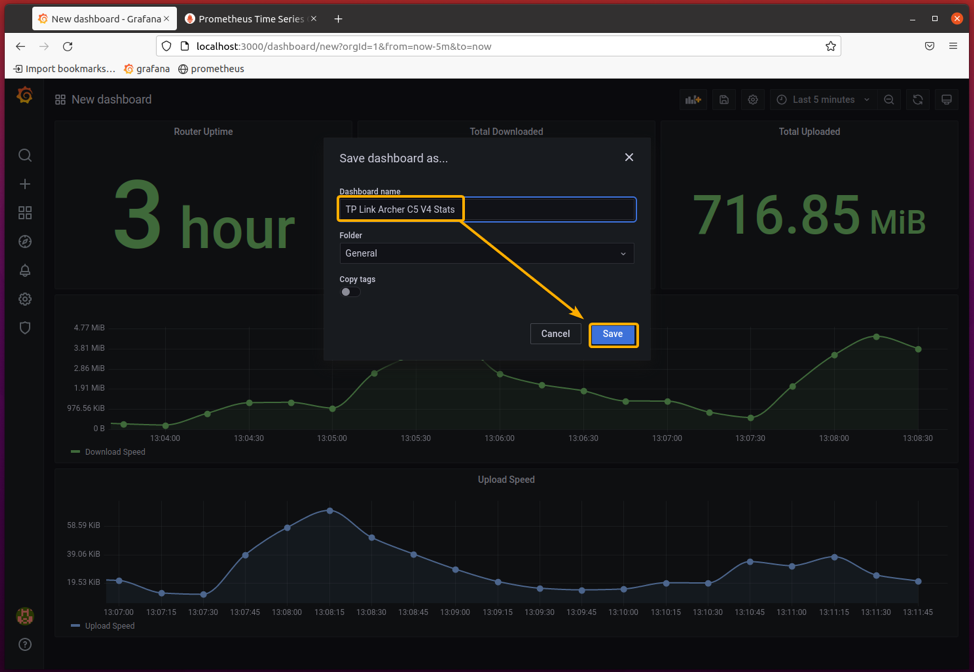
Type in a meaningful name for the Dashboard and click on Save.
I will call it TP Link Archer C5 V4 Stats.
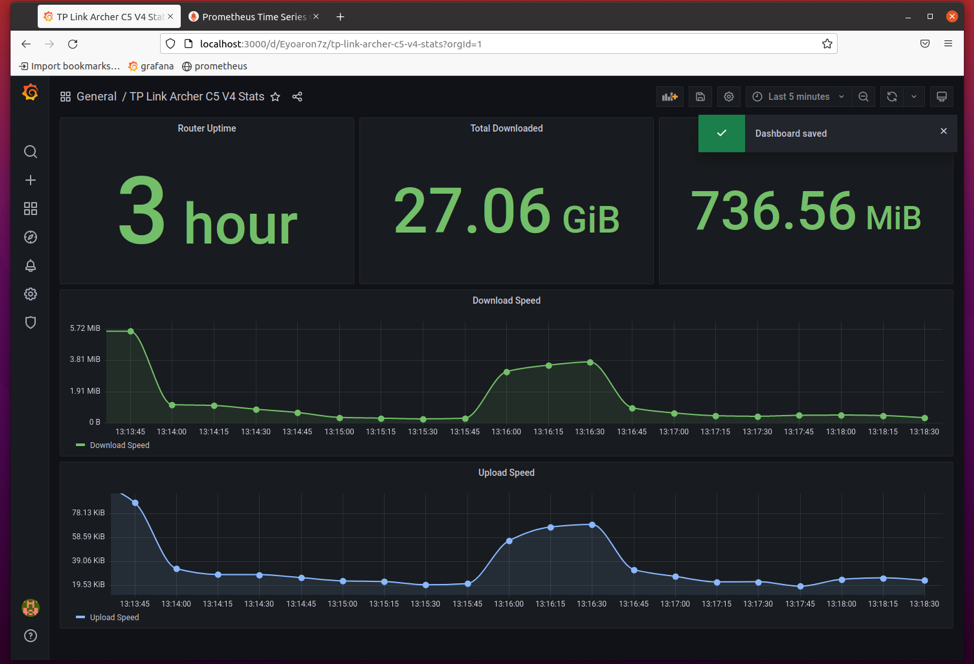
The Dashboard should be saved.
Set a Default Grafana Dashboard
To set the Dashboard as the default Grafana dashboard, you must star the Dashboard first.
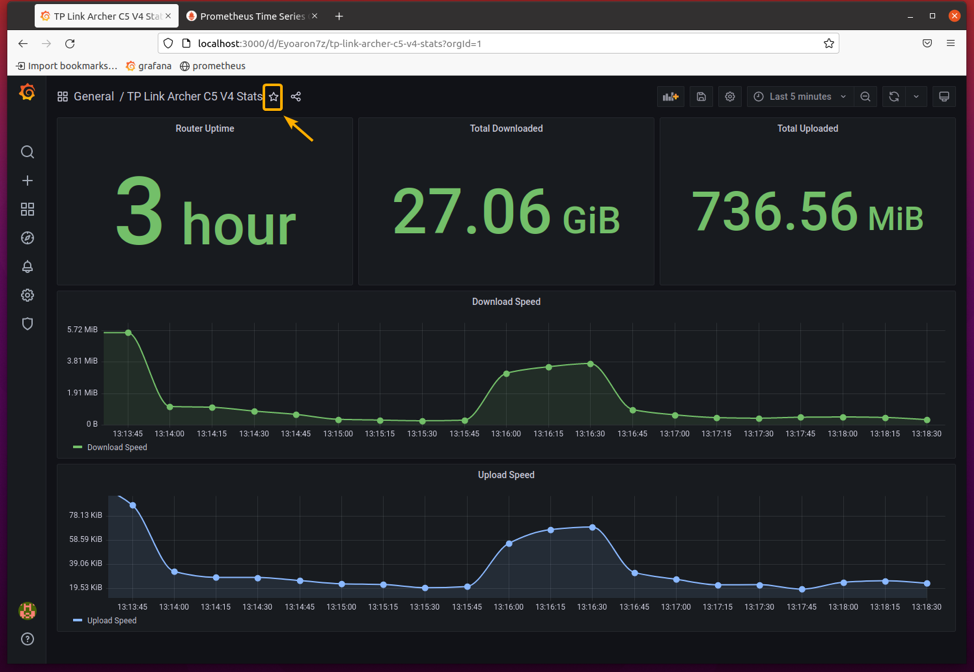
To star the Dashboard, click on the star icon as marked in the screenshot below.
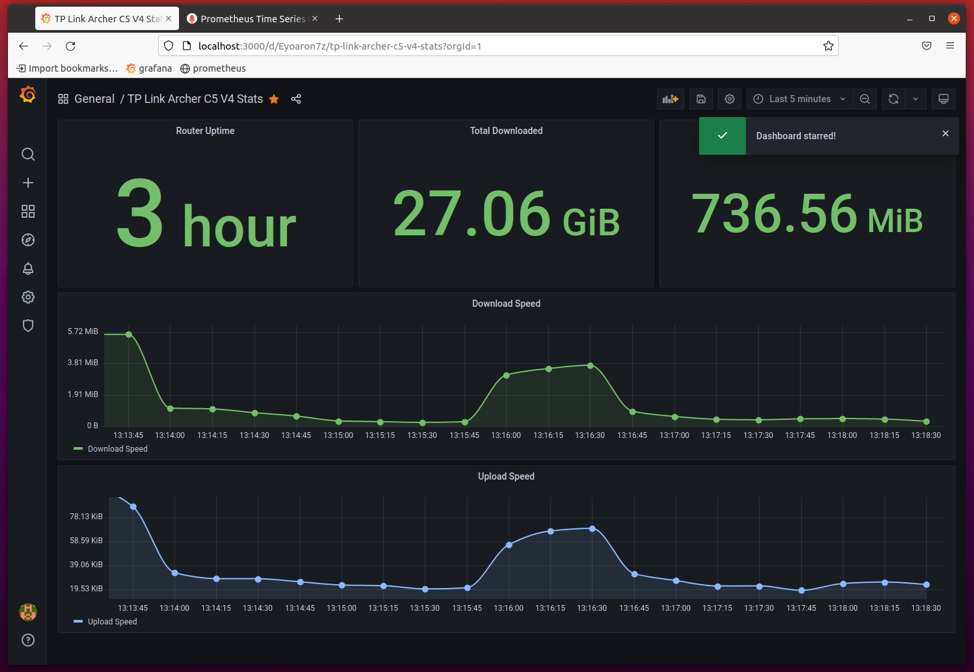
The Dashboard should be starred.
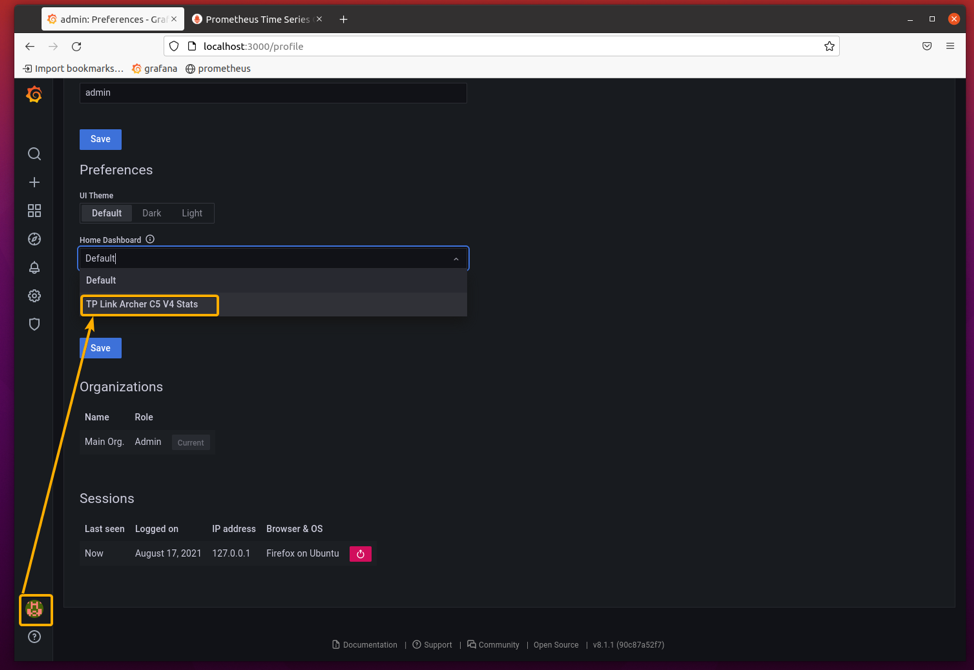
Now, you can select the Dashboard from the Home Dashboard dropdown menu of the Grafana Settings page, as you can see in the screenshot below.
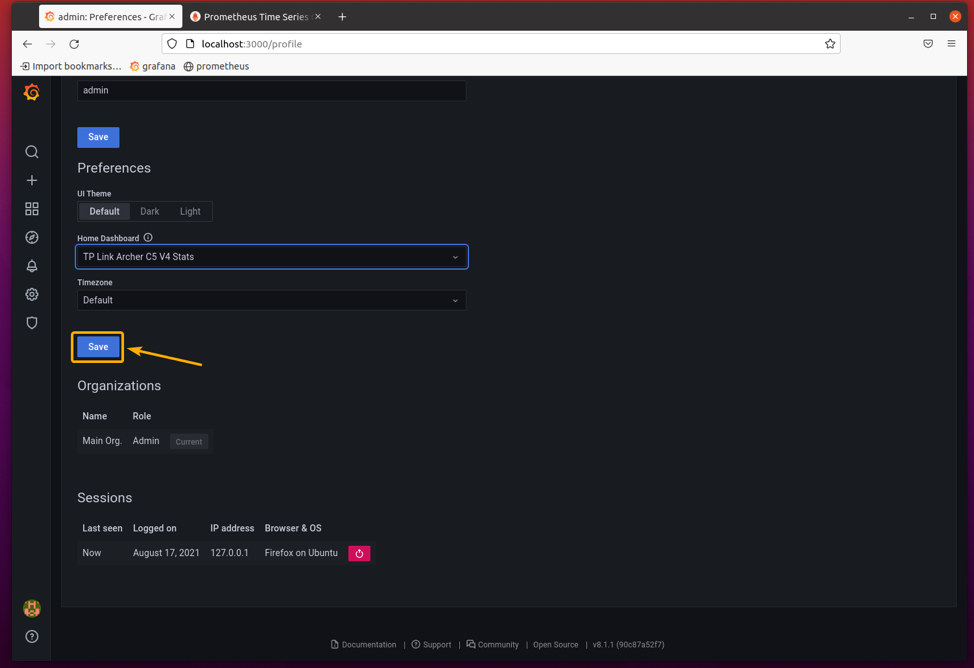
Once you’re done, click on Save for the changes to take effect.
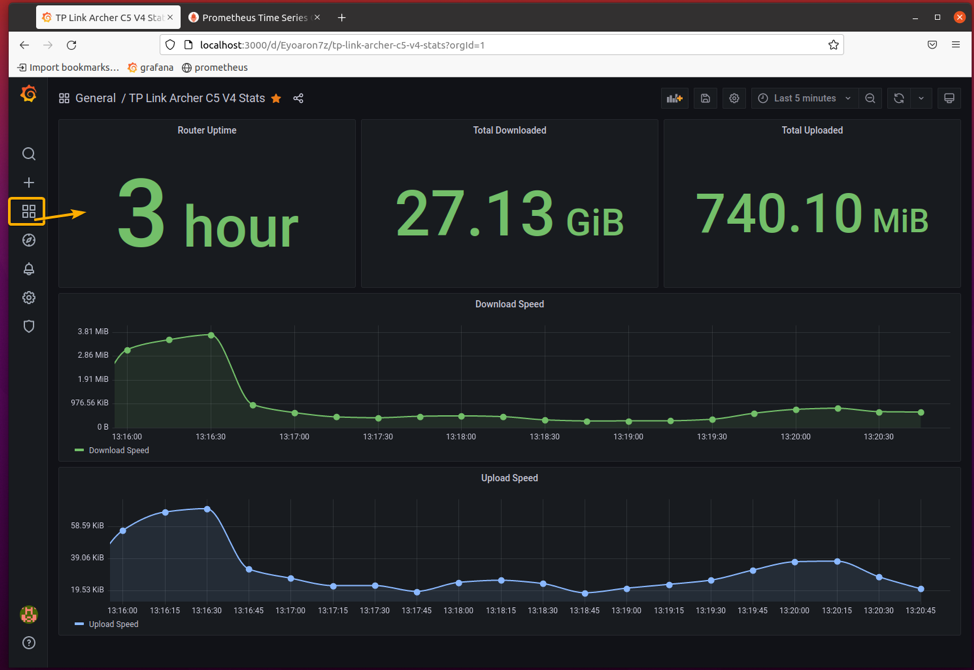
If you click on the Dashboard icon , the newly created Dashboard should be displayed by default.
Where to Go Next?
Pulling data from a network device via SNMP puts a lot of stress on the CPU of the network device. So, it’s not good to pull the data you don’t need from the network devices via SNMP. It’s a good practice to pull only the data that you need for monitoring the network devices.
You can easily configure snmp_exporter to pull specific data from the network devices via SNMP. All you have to do is use the generator that snmp_exporter provides to generate a new snmp.yml configuration file.
Unfortunately, it is out of the scope of this article to show you how to do that. For more information on generating a custom snmp_exporter configuration file, check out the Generating configuration section of the SNMP exporter GitHub page.
Conclusion
In this article, I have shown you how to install snmp_exporter on Ubuntu 20.04 LTS and add it to Prometheus for monitoring network devices via SNMP. I have also shown you how to enable SNMP on your TP-Link home router. I have shown you how to use Grafana to create a Dashboard for monitoring network devices using Prometheus and set the Dashboard as the default Grafana Dashboard as well. This article should help you get started with monitor network devices with Grafana and Prometheus.
References
[1] GitHub – prometheus/snmp_exporter: SNMP Exporter for Prometheus
[2] q_a_supported_public_mibs_for_tp-link_switches
[3] GitHub – prometheus/snmp_exporter: SNMP Exporter for Prometheus – Generating configuration

