
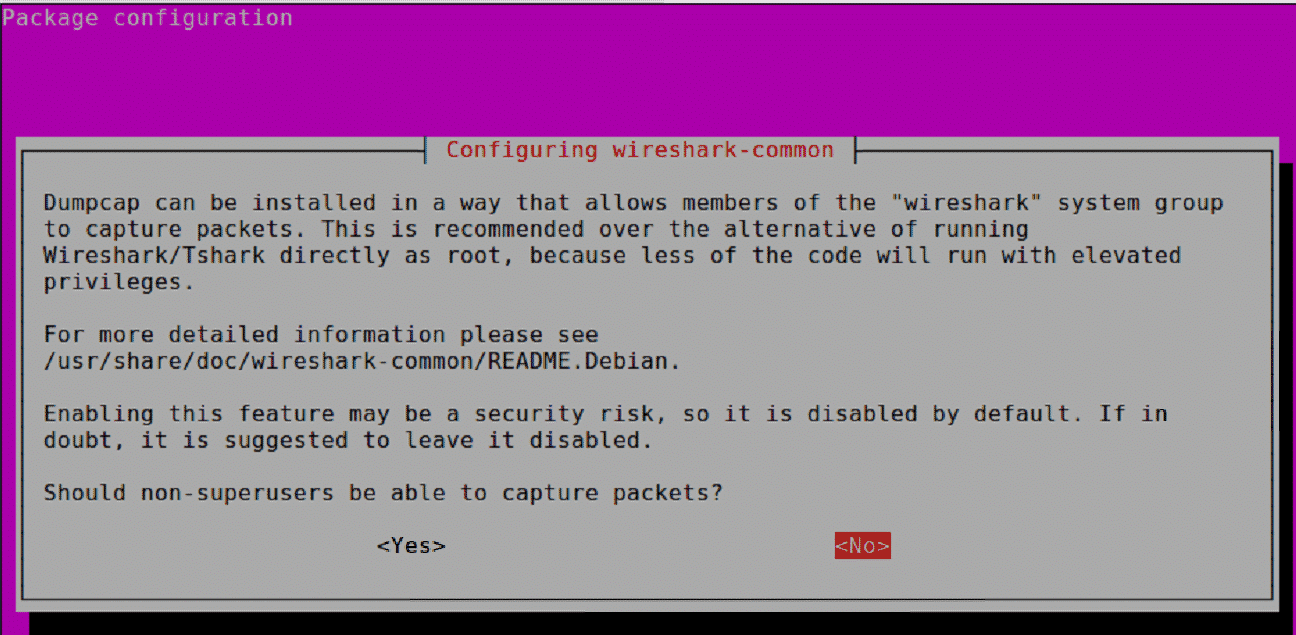
The above command should start the Wireshark installation process. If the below screenshot window occurs, we have to press “Yes”.
Once the installation is completed, we can Wireshark version using the below command.
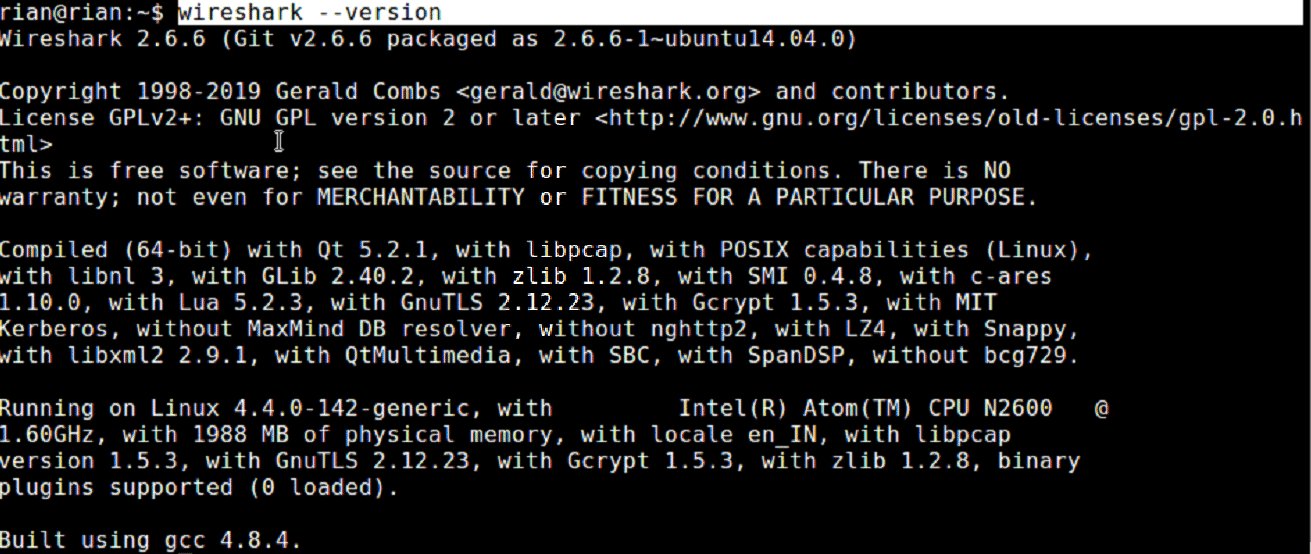
So, installed Wireshark version is 2.6.6, but from official link [https://www.wireshark.org/download.html], we can see the latest version is more than 2.6.6.
To install the latest Wireshark version, follow the below commands.
$ sudo apt-get update
$ sudo apt-get install Wireshark
Or
We can install manually from the below link if the above commands do not help. https://www.ubuntuupdates.org/pm/wireshark
Once Wireshark is installed, we can start Wireshark from the command line by typing
Or
by searching from Ubuntu GUI.
Note that we will try to use the latest Wireshark [3.0.1] for further discussion, and there will be very little differences between different versions of Wireshark. So, everything will not match exactly, but we can understand the differences easily.
We can also follow https://linuxhint.com/install_wireshark_ubuntu/ if we need step by step Wireshark installation help.
Introduction to the Wireshark:
-
graphical interfaces and Panels:
Once Wireshark is launched, we can select the interface where we want to capture, and Wireshark window looks like below

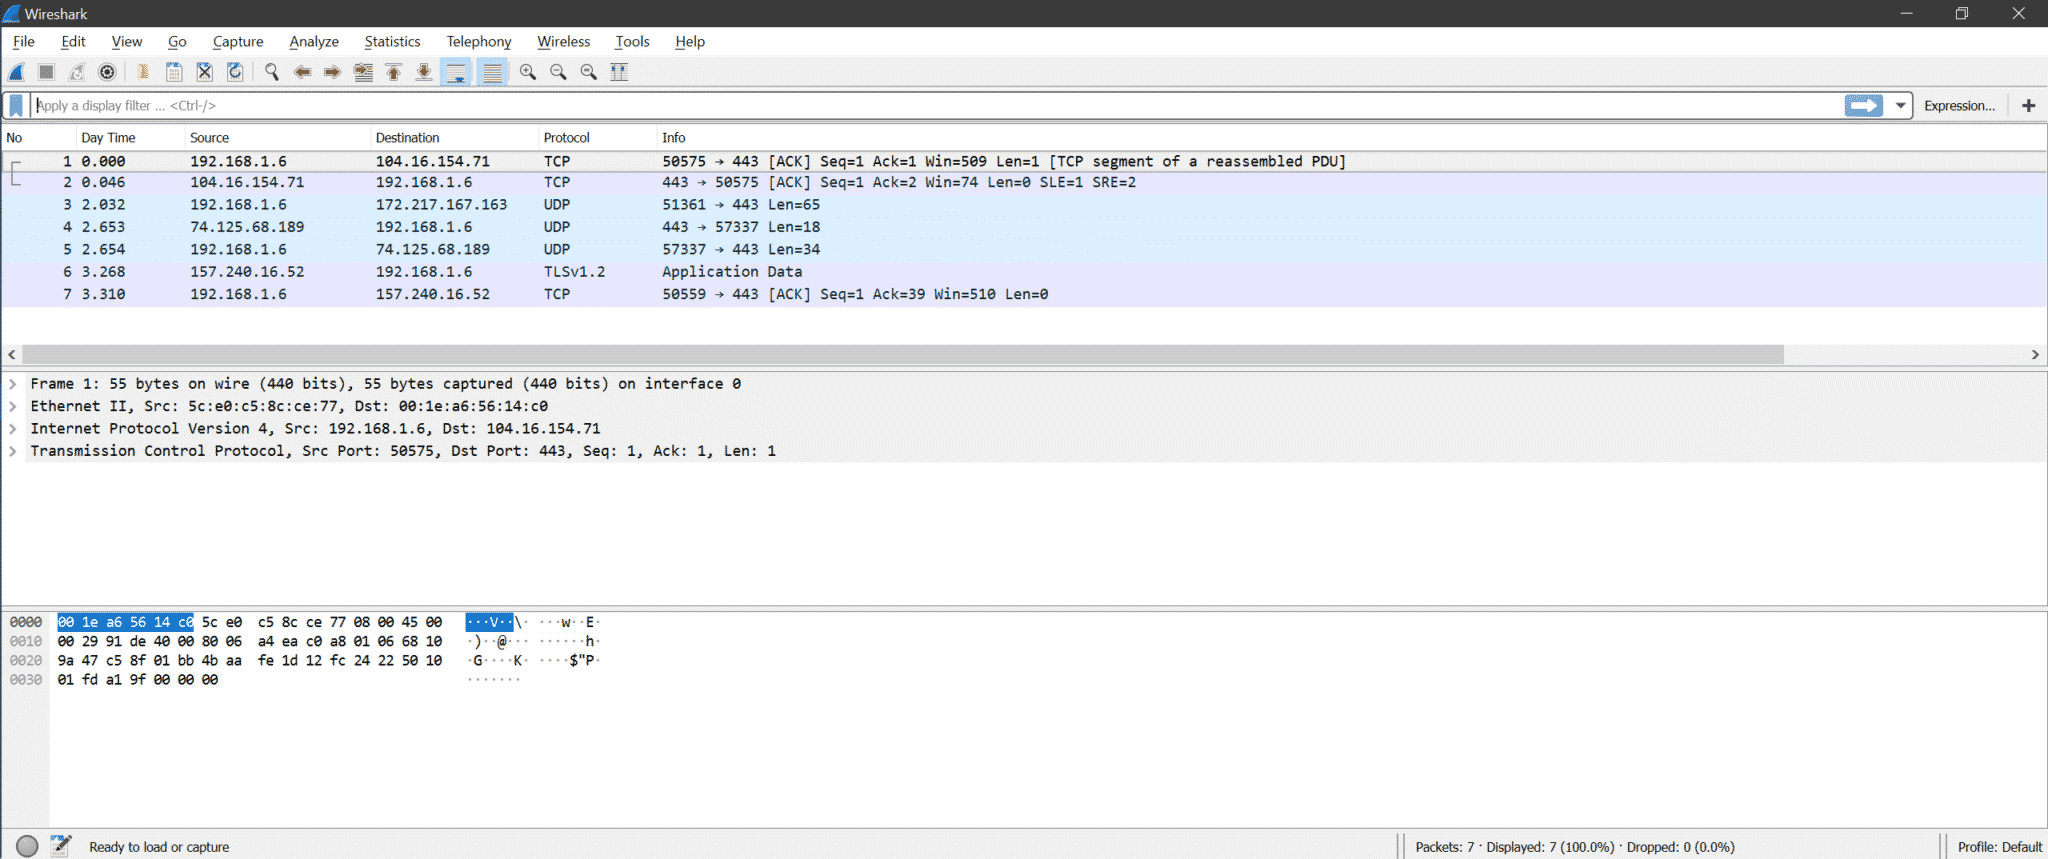
Once we choose the correct interface for capturing the whole Wireshark window looks like below.
There are three sections inside Wireshark
- Packet List
- Packet Details
- Packet Bytes
Here is the screenshot for understanding
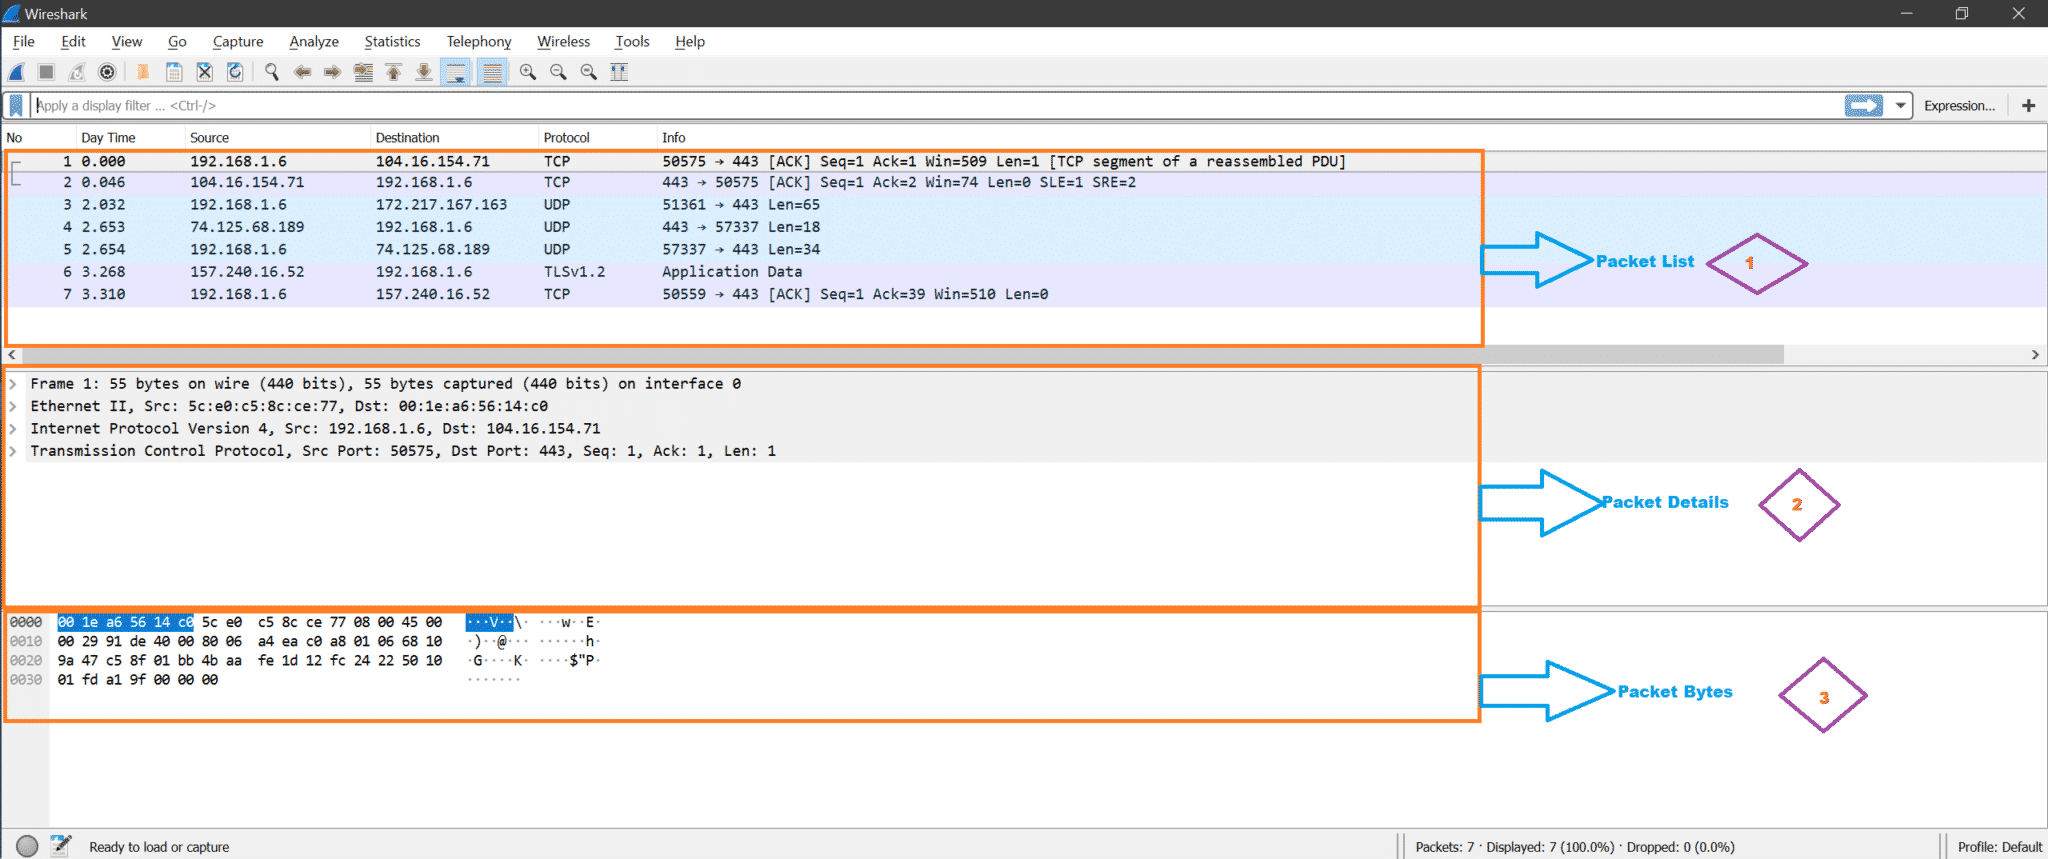
Packet List: This section displays all packets captured by Wireshark. We can see the protocol column for the type of packet.
Packet Details: Once we click on any packet from Packet List, packet details show supported networking layers for that selected packet.
Packet Bytes: Now, for the selected field of the selected packet, hex (default, It can be changed to binary also) value will be shown under the Packet Bytes section in Wireshark.
-
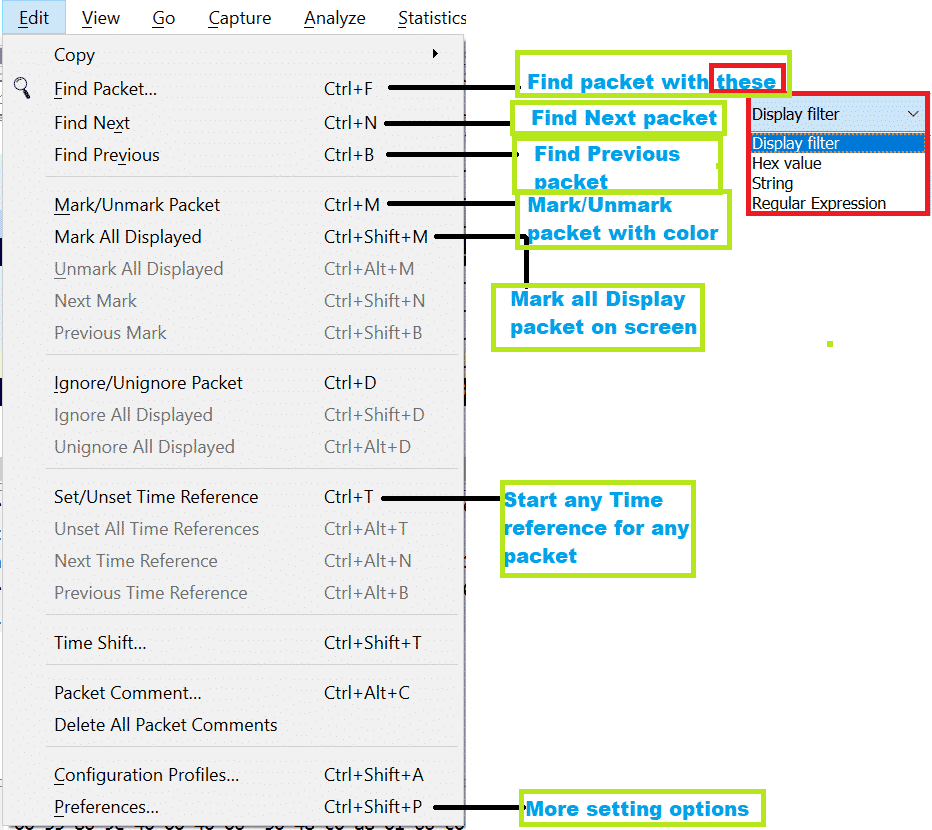
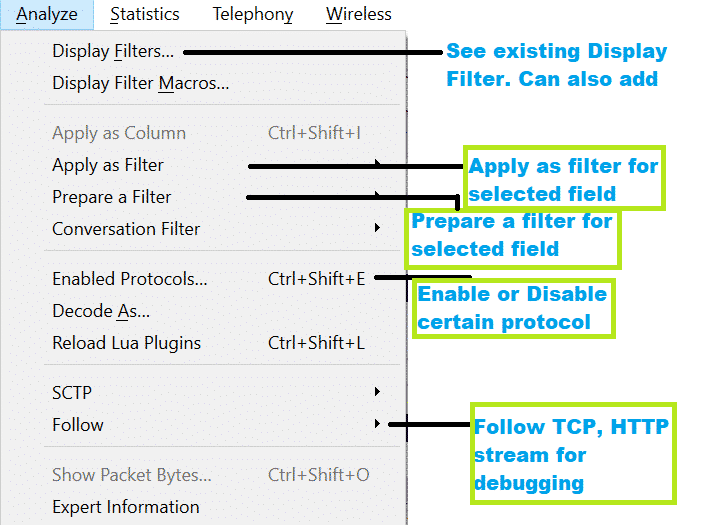
Important Menus and Options:
Here is the screenshot from Wireshark.
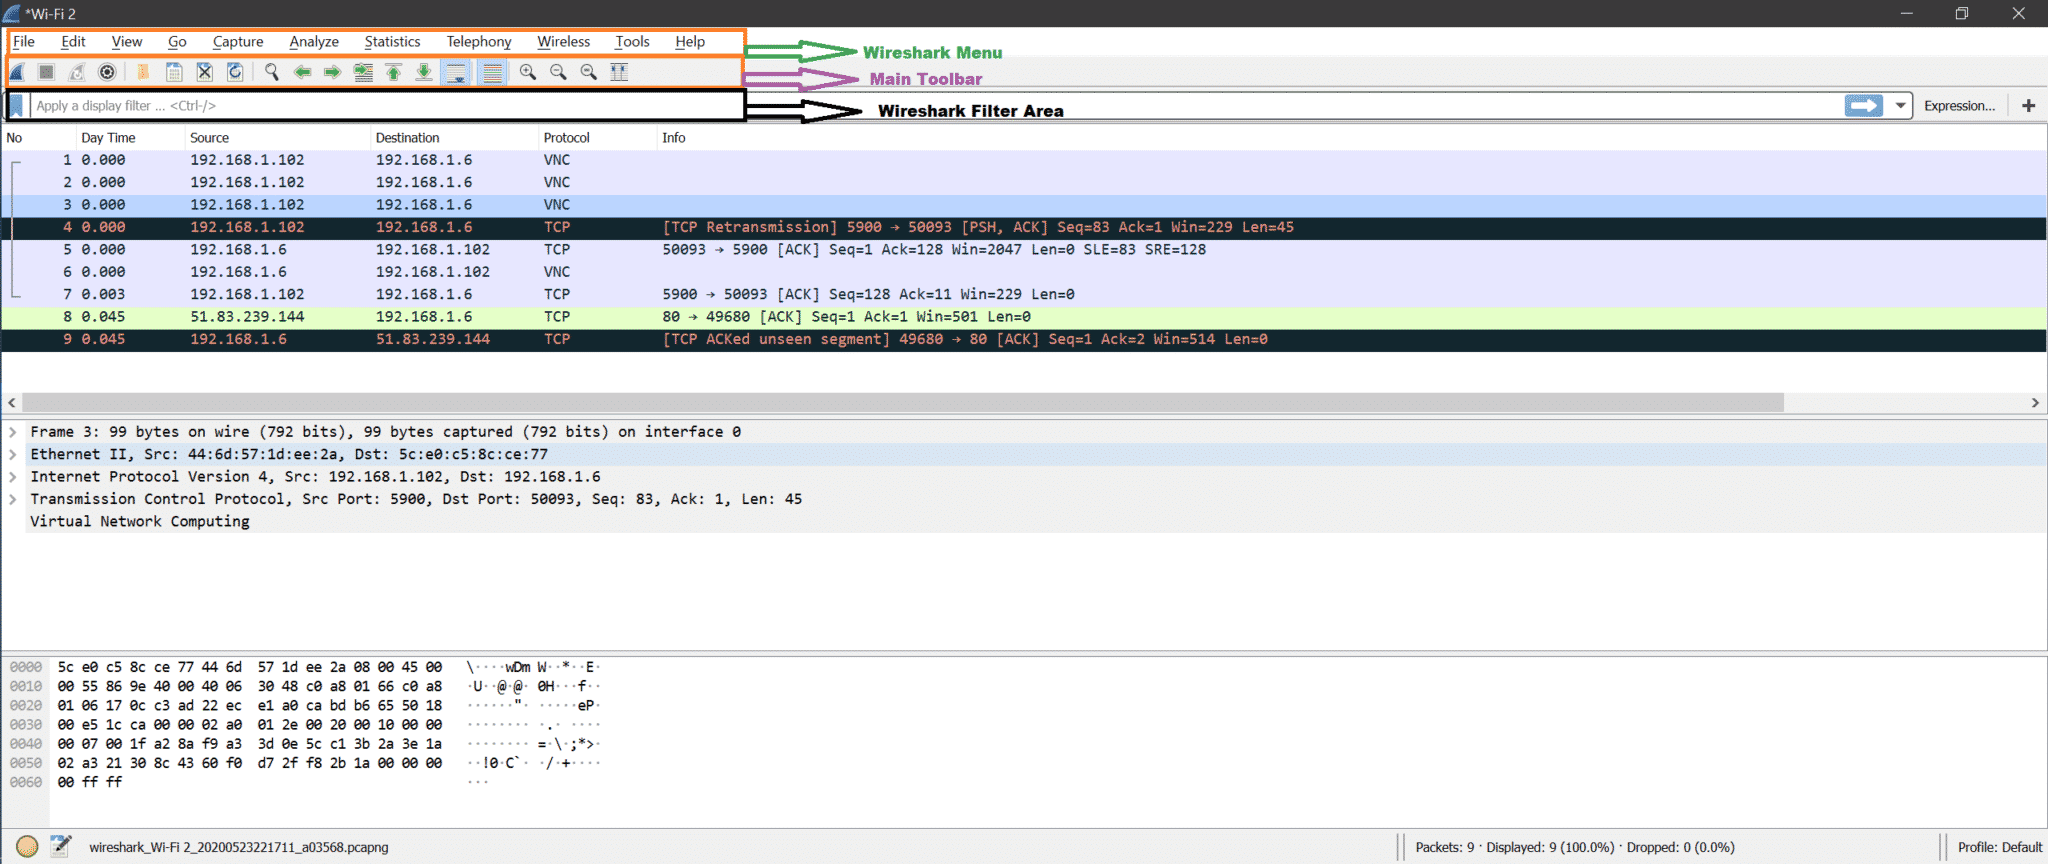
Now there are many options, and most of them are self-explanatory. We will learn about those while doing analysis on captures.
Here are some important options are shown using a screenshot.
TCP/IP Fundamentals:
Before going to do packet analysis, we should be aware basics of networking layers [https://linuxhint.com/osi_network_layer_analsysis_wireshark/].
In general, there are 7 layers for the OSI model and 4 Layer for the TCP/IP model shown in the below diagram.
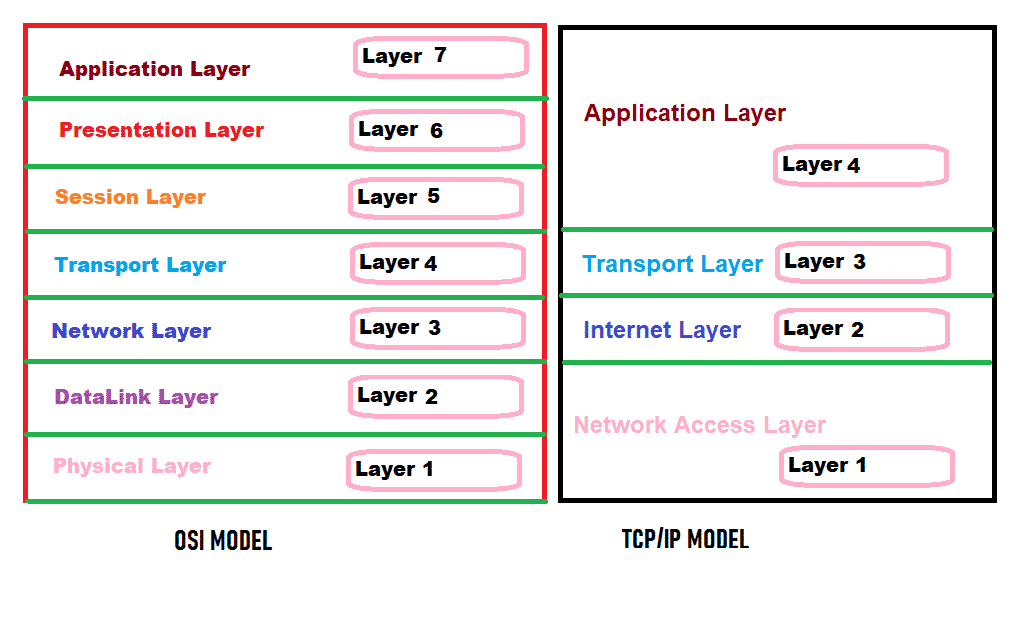
But in Wireshark, we will see below layers for any packet.
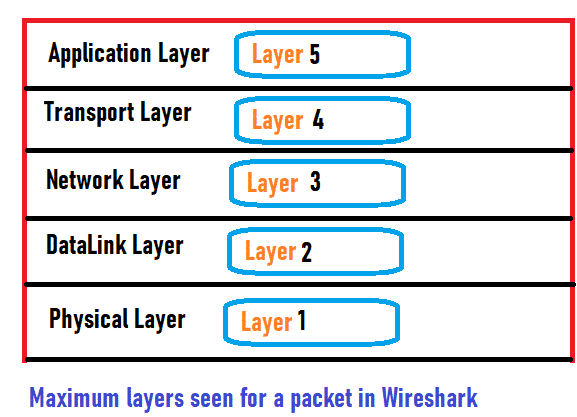
Each layer has its job to do. Let’s have one quick look at each layer’s job.
Physical Layer: This layer can transmit or receive raw binary bits over a physical medium like Ethernet cable.
Data Link Layer: This layer can transmit or receive a data frame between two connected nodes. This layer can be divided into 2 components, MAC and LLC. We can see the MAC address of the device in this layer. ARP works in the Data Link Layer.
Network Layer: This layer can transmit or receive a packet from one network to another network. We can see the IP address (IPv4/IPv6) in this layer.
Transport Layer: This layer can transmit or receive data from one device to another using a port number. TCP, UDP are transport layer protocols. We can see the port number is used in this layer.
Application Layer: This layer is closer to the user. Skype, Mail service, etc. are the example of application layer software. Below are some protocols which run in the application layer
HTTP, FTP, SNMP, Telnet, DNS etc.
We will understand more while analyzing the packet in Wireshark.
Live Capture of network traffic
Here are the steps to capture on a live network:
Step1:
We should know where [Which Interface] to capture packets. Let’s understand the scenario for a Linux laptop, which has an Ethernet NIC card and Wireless card.
:: Scenarios ::
- Both are connected and have valid IP addresses.
- Only Wi-Fi is connected, but Ethernet is not connected.
- Only Ethernet is connected, but Wi-Fi is not connected.
- No interface is connected to the network.
- OR there are multiple Ethernet and Wi-Fi cards.
Step2:
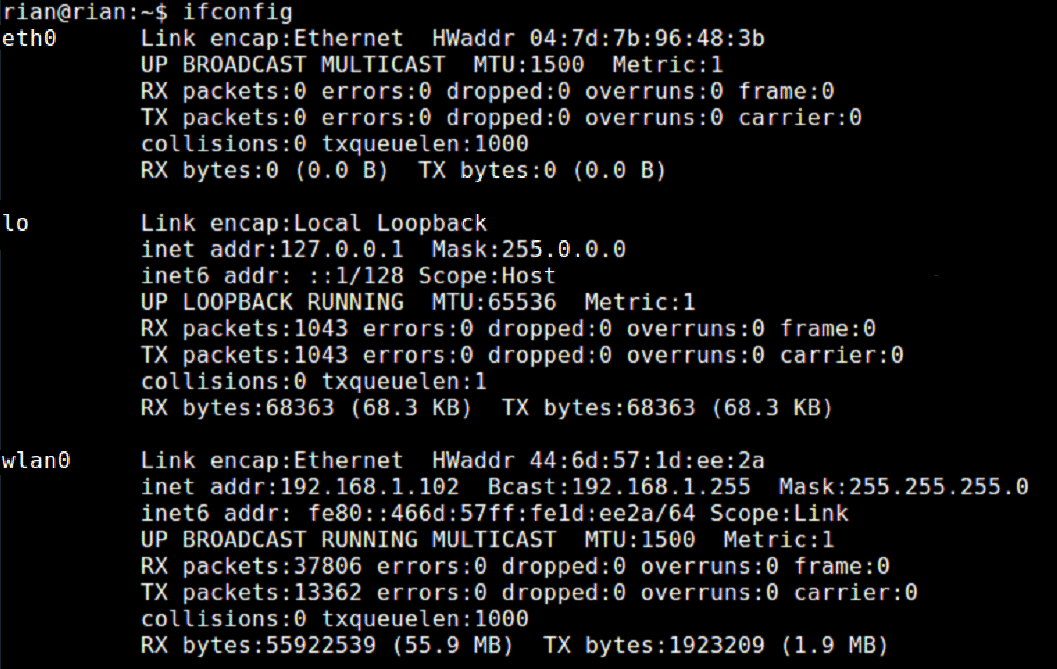
Open terminal using Atrl+Alt+t and type ifconfig command. This command will show all up interface with IP address if any interface has. We need to see the interface name and remember. The below screenshot shows the scenario of “Only Wi-Fi is connected, but Ethernet is not connected.”
Here is the screenshot of command “ifconfig” which shows that only wlan0 interface has the IP address 192.168.1.102. That means wlan0 is connected to the network, but ethernet interface eth0 is not connected. This means we should capture on the wlan0 interface to get to see some packets.
Step3:
Launch Wireshark, and you will see the interfaces list on the home page of Wireshark.
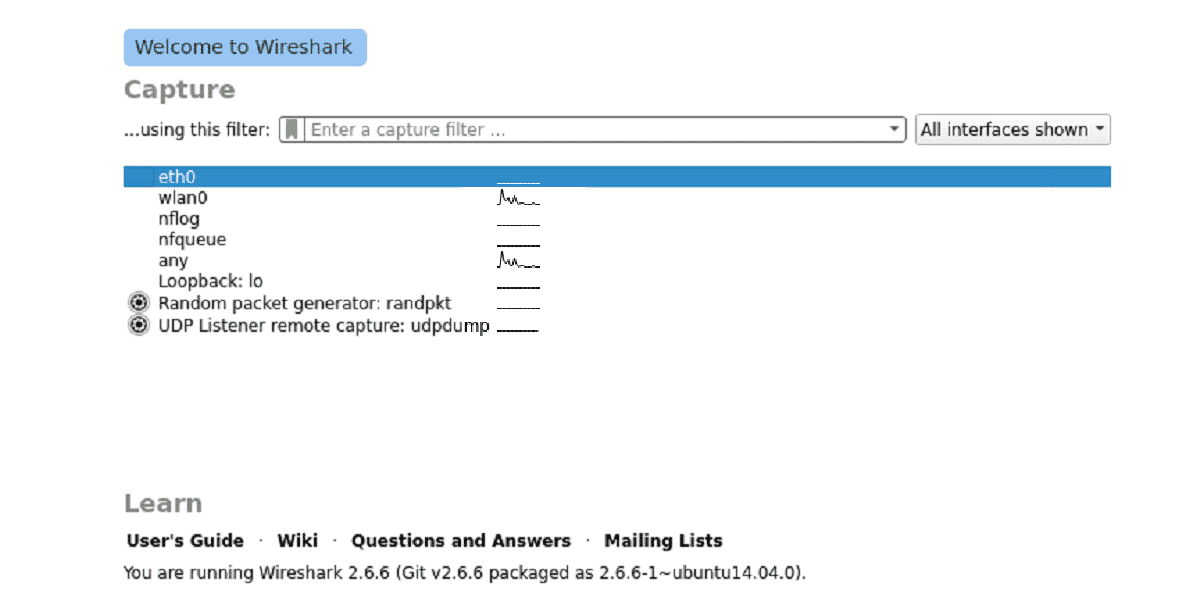
Step4:
Now click on the required interface, and Wireshark will start capturing.
See the screenshot to understand live capture. Also, look for Wireshark’s indication for “live capture is in progress” at the bottom of Wireshark.

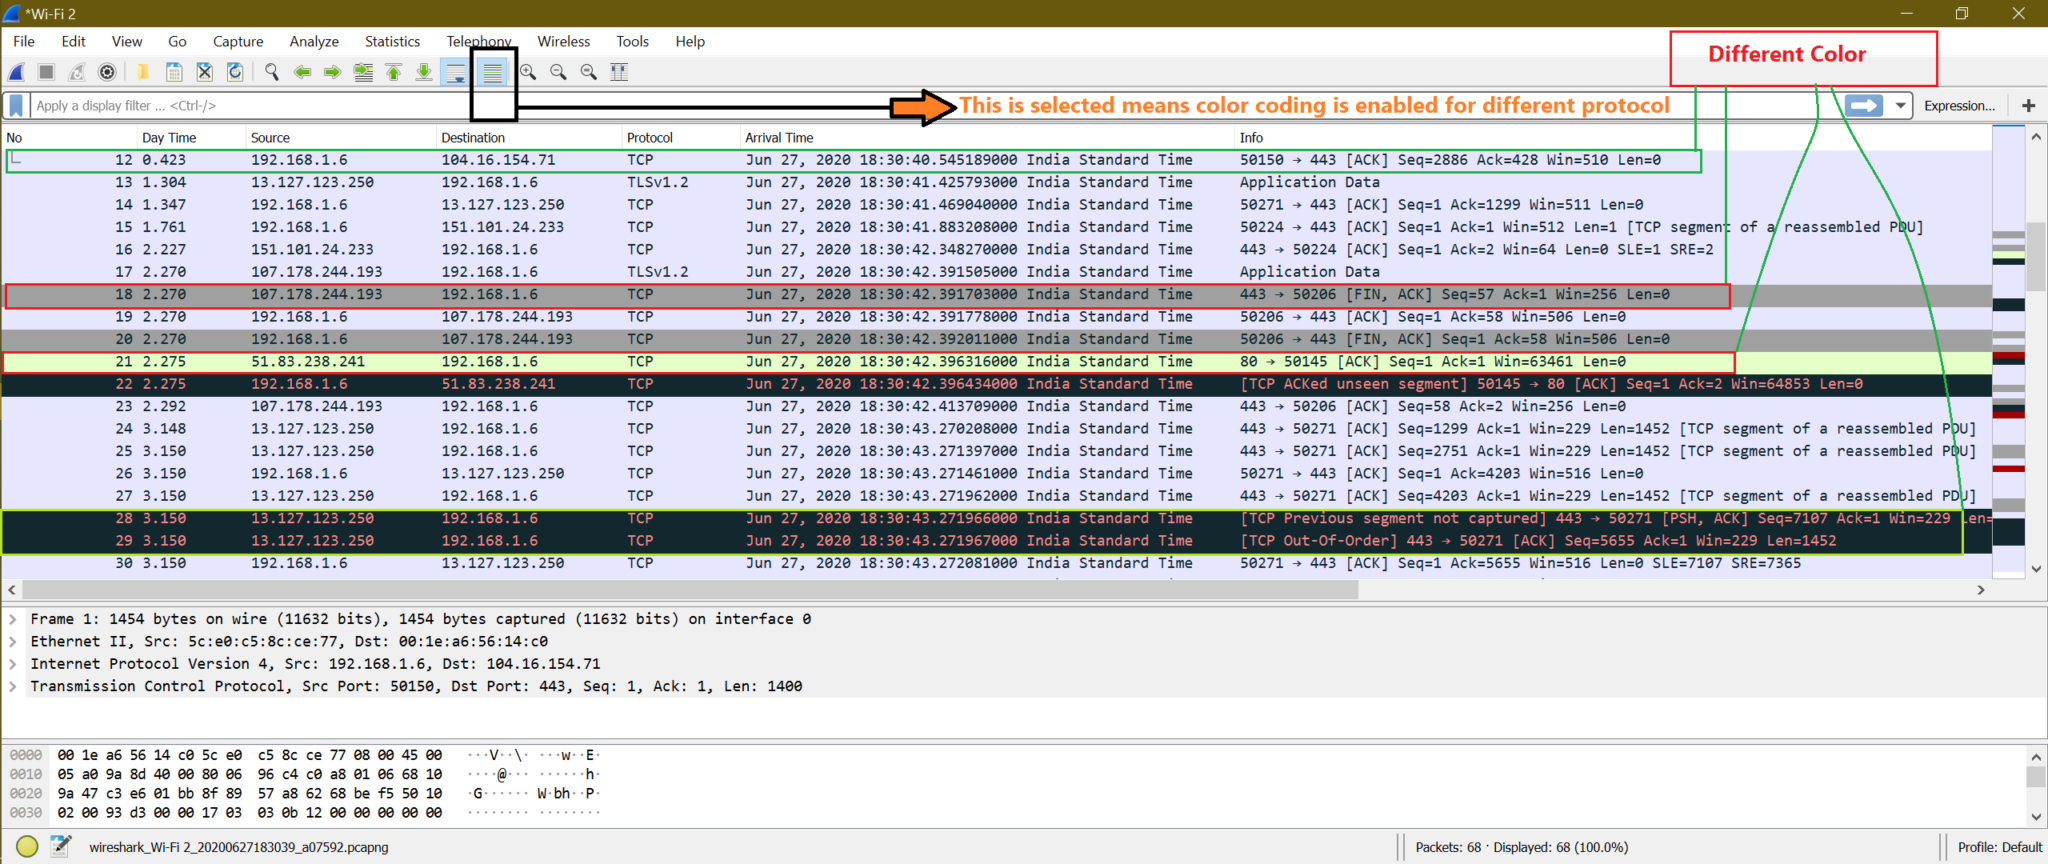
Color coding of traffic in Wireshark:
We may have noticed from previous screenshots that different types of packets have a different color. Default color coding is enabled, or there is one option to enable color-coding. Look at the screenshot below
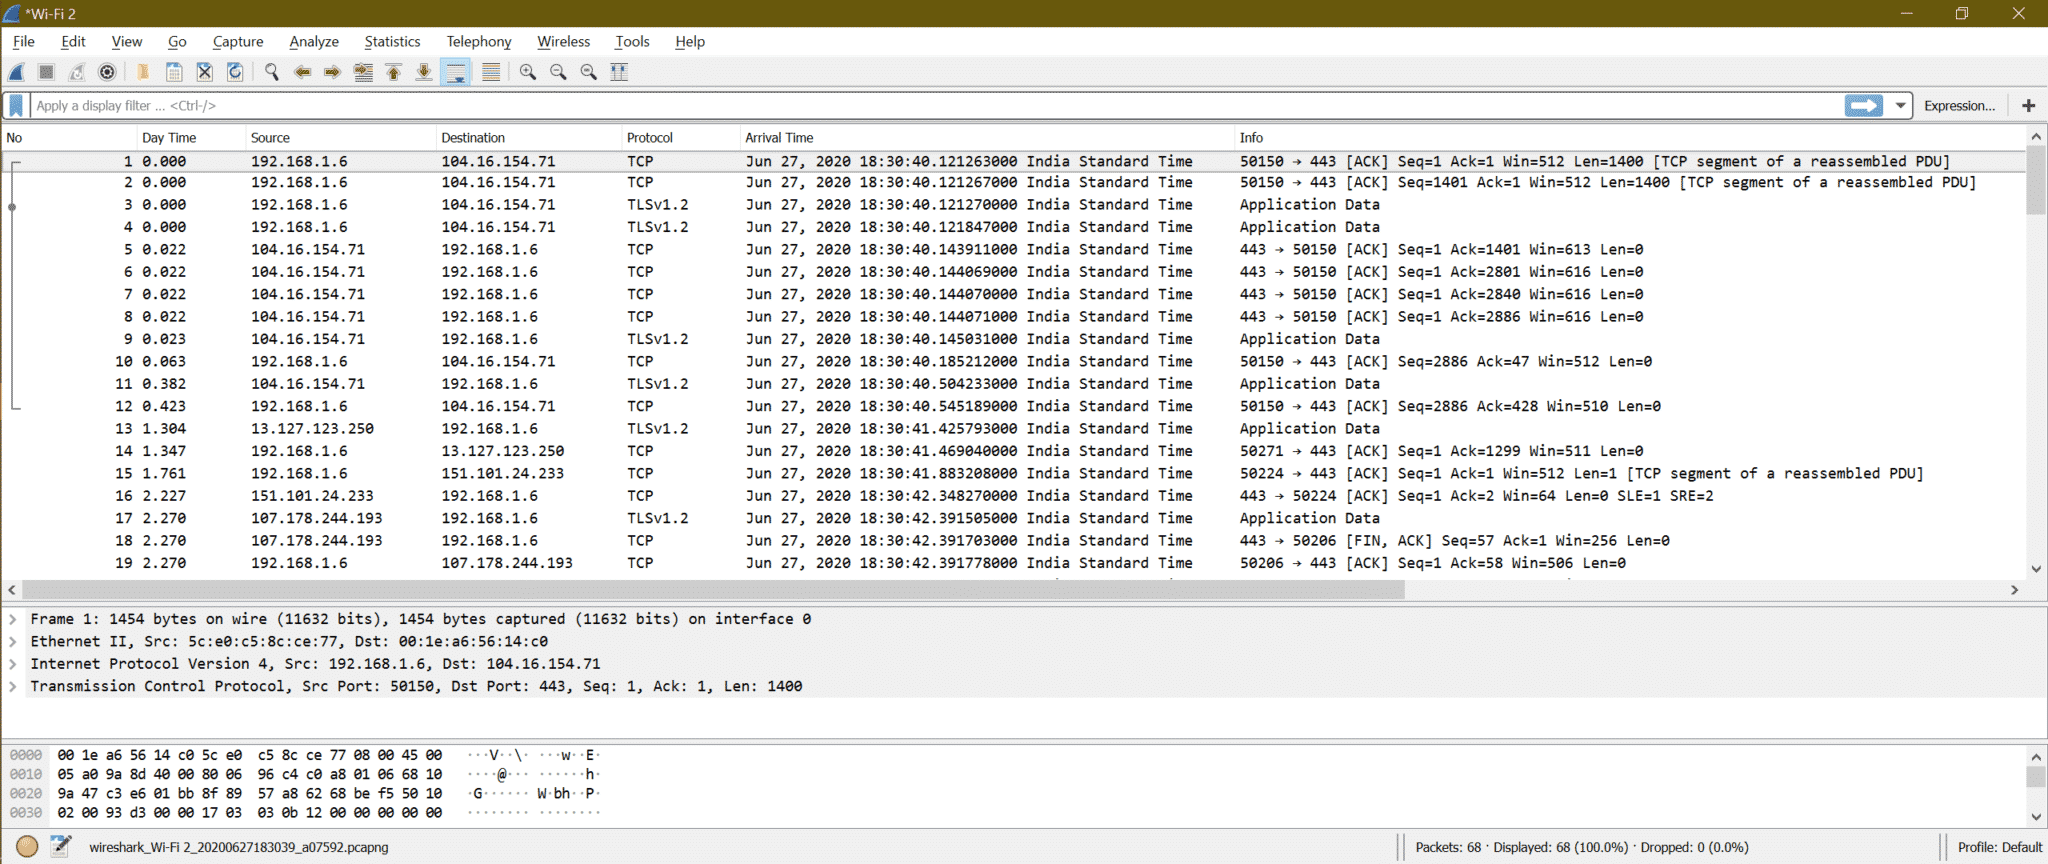
Here is the screenshot when color coding is disabled.
Here is the setting for coloring rules at Wireshark
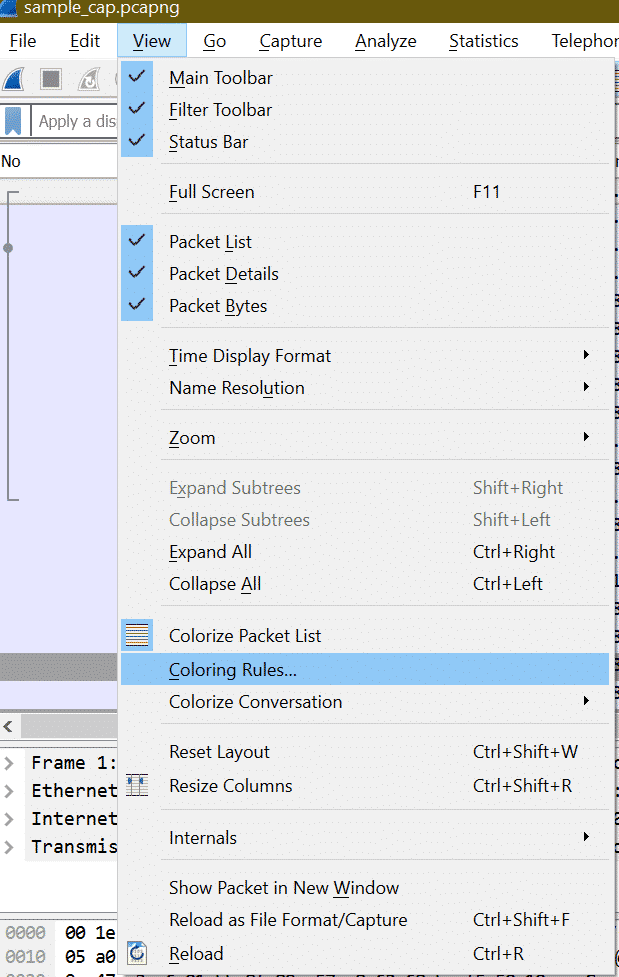
After clicking “Coloring Rules” below window will be opened.
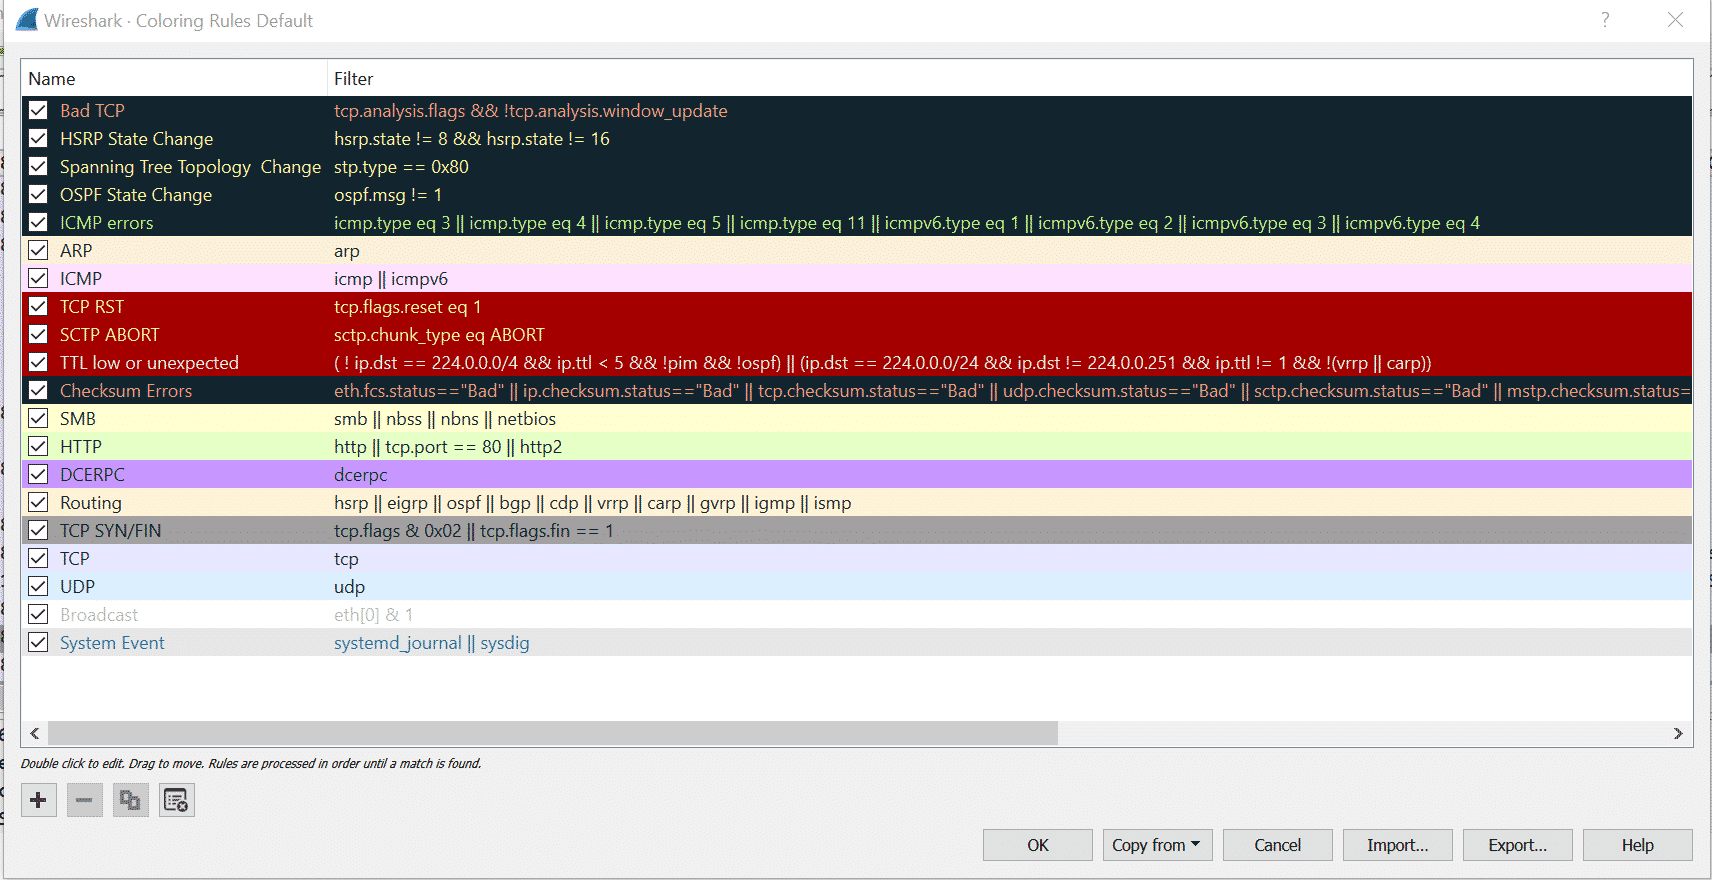
Here we can customize the coloring rules for Wireshark packets for each protocol. But the default setting is quite good enough for capture analysis.
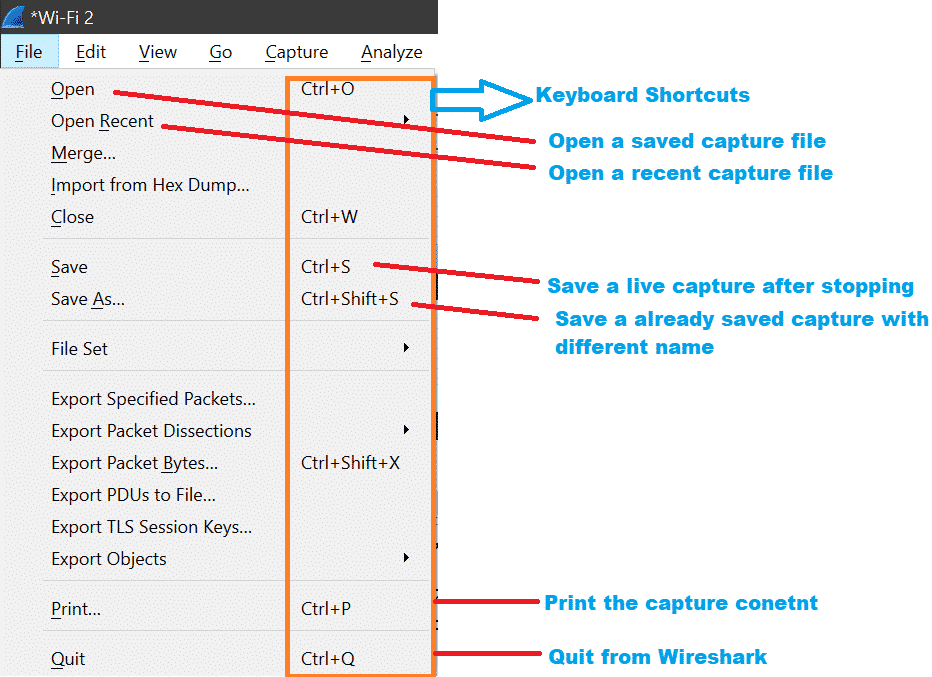
Saving Capture to a file
After stopping the live capture, here are the steps to save any capture.
Step1:
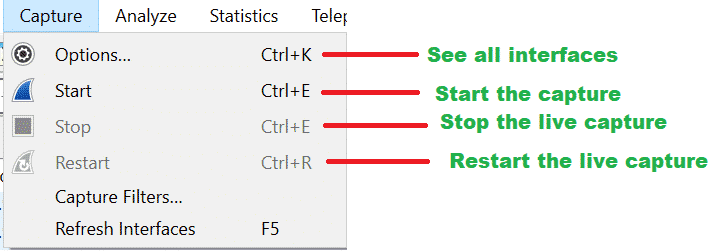
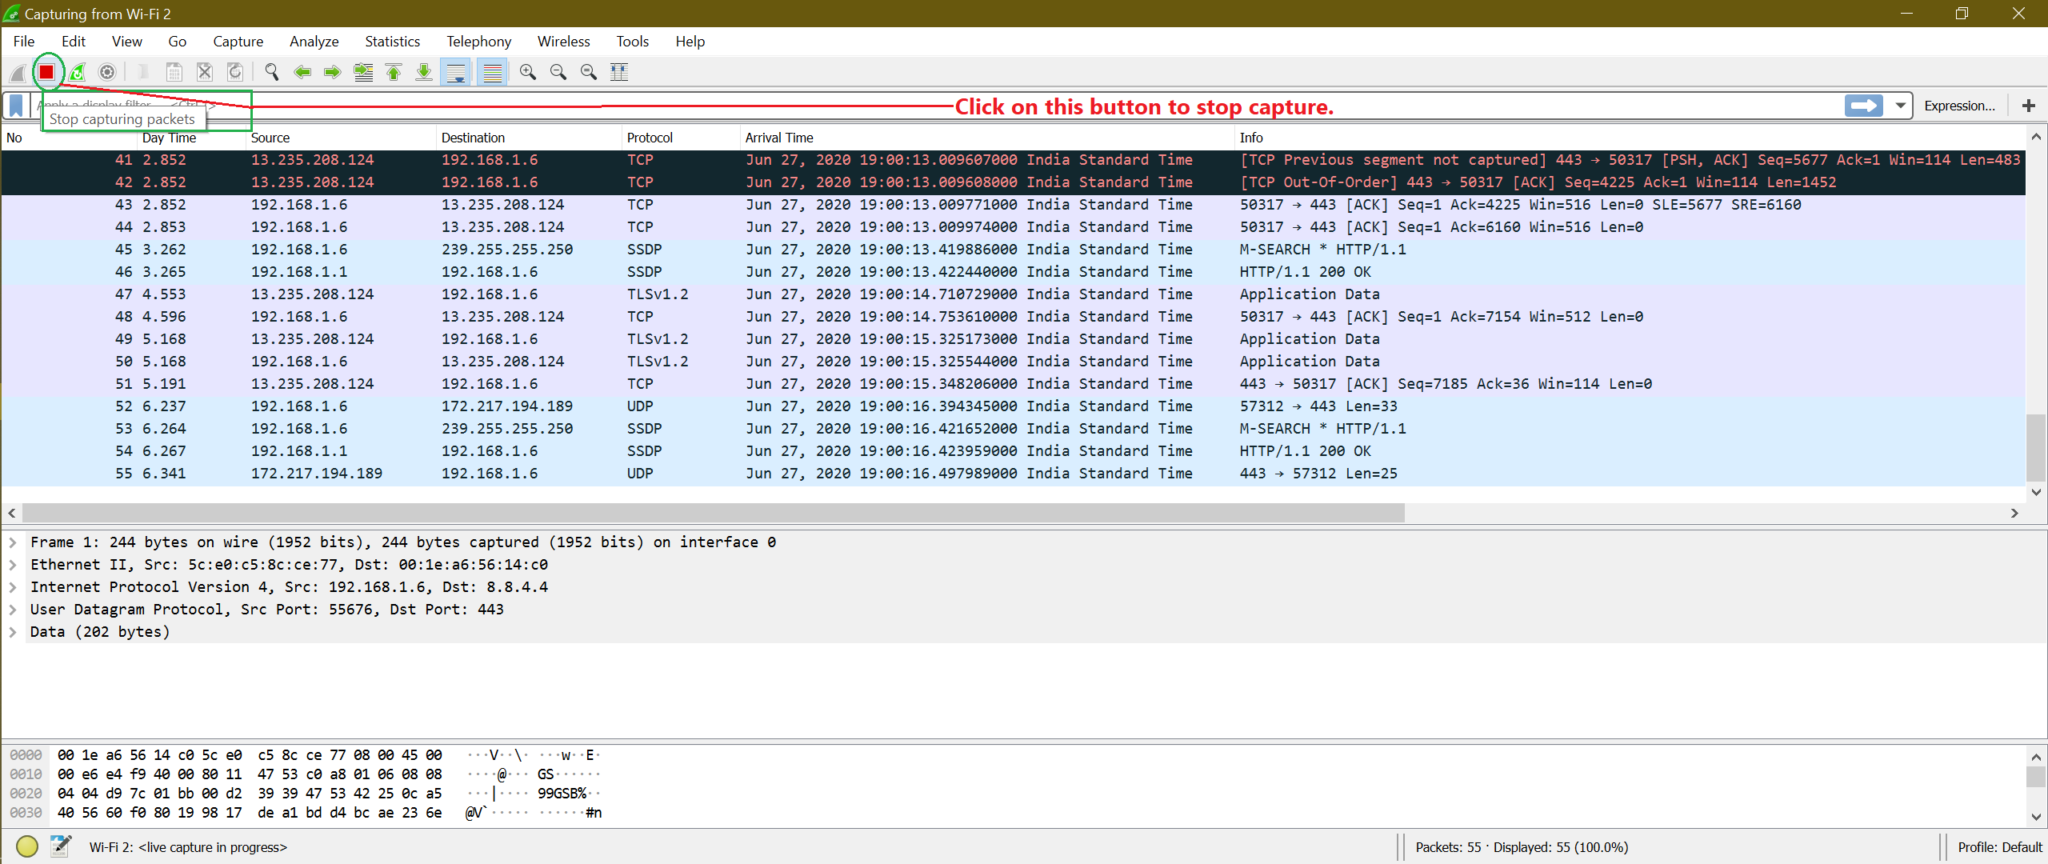
Stop the live capture by clicking below the marked button from screenshot or by using shortcut “Ctrl+E”.
Step2:
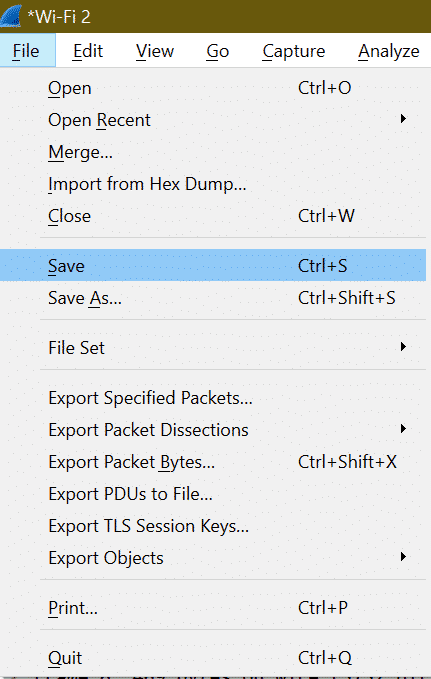
Now to save file go to File->save or use shortcut “Ctrl+S”
Step3:
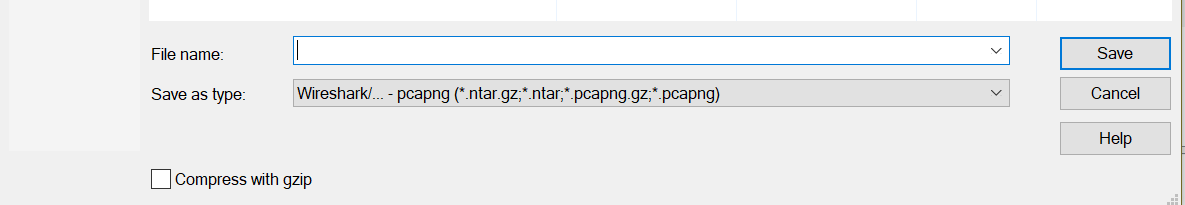
Enter the file name and click on Save.
Loading a Capture file
Step1:
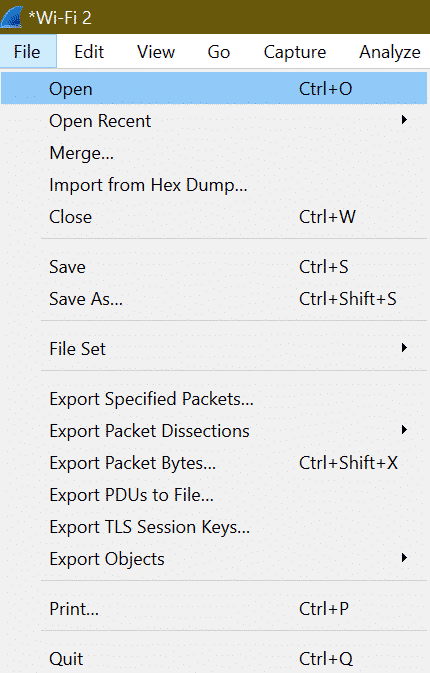
To load any existing saved file, we have to go to File->Open or use the shortcut “Ctrl+O”.
Step2:
Then choose the required file from the system and click open.

What important details can be found in packets that can help with forensic analysis?
To answer questions first, we need to know what kind of network attack we are dealing with. As there are different kinds of network attack which uses different protocols so we can not say any fix Wireshark packet field to identify any issue. We are going to find this answer when we will discuss each networking attack in detail under “Network Attack”.
Creating Filters on traffic type:
There may be many protocols in a capture, so if we are looking for any specific protocol like TCP, UDP, ARP, etc., we need to type the protocol name as a filter.
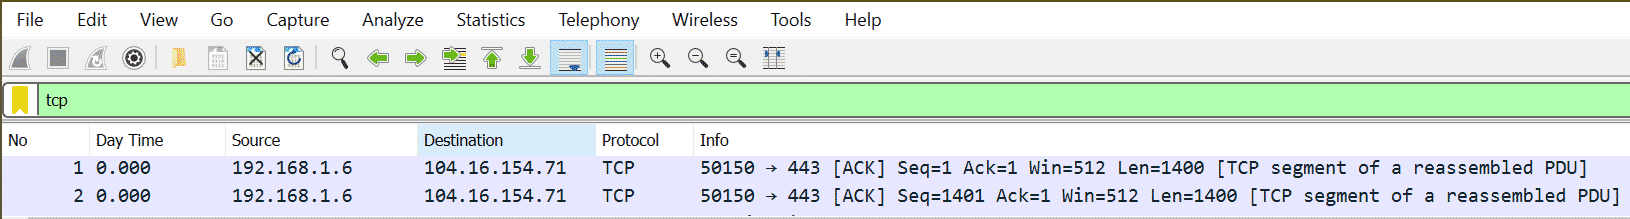
Example: To show all TCP packets, the filter is “tcp”.
For UDP filter is “udp”
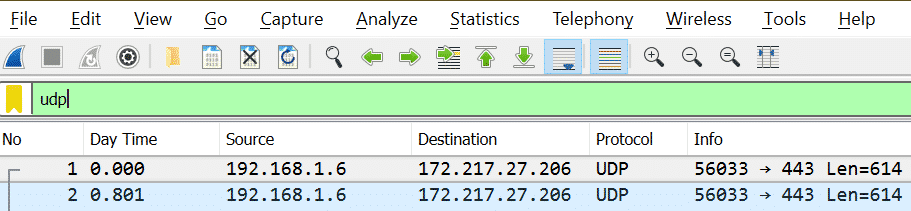
Note that: After typing the filter name, if the color is green, that means it’s a valid filter or else its invalid filter.
Valid Filter:

Invalid Filter:
![]()
Creating filters on address:
There are two types of addresses we can think of in case of networking.
1. IP address [Example: X = 192.168.1.6]
| Requirement | Filter |
| Packets where IP is X | ip.addr == 192.168.1.6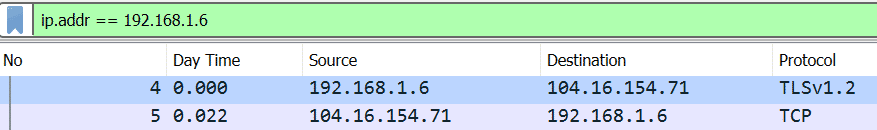 |
| Packets where source IP is X | ip.src == 192.168.1.6 |
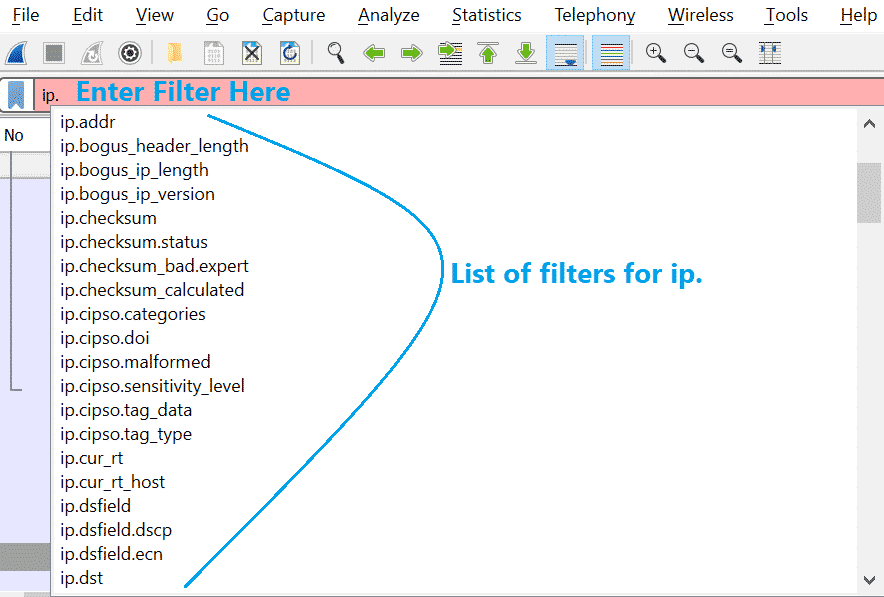
| Packets where destination IP is X | ip.dst == 192.168.1.6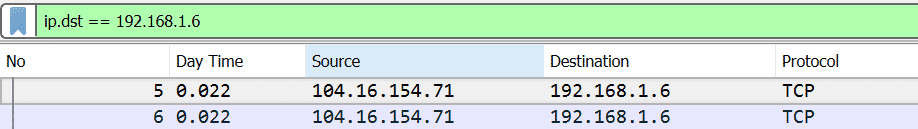 |
We can see more filters for ip after following below step shown in the screenshot
2. MAC address [Example: Y = 00:1e:a6:56:14:c0]
This will be similar to previous table.
| Requirement | Filter |
| Packets where MAC is Y | eth.addr == 00:1e:a6:56:14:c0 |
| Packets where source MAC is Y | eth.src == 00:1e:a6:56:14:c0 |
| Packets where destination MAC is Y | eth.dst == 00:1e:a6:56:14:c0 |
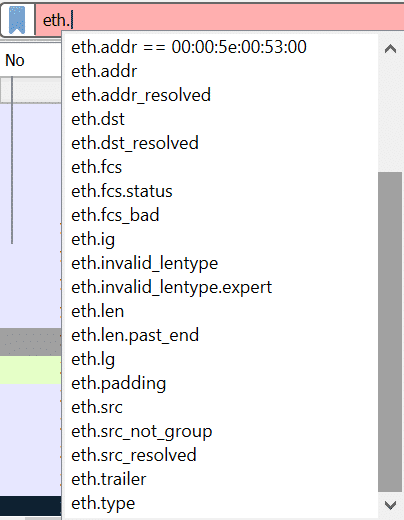
Like ip, we can also get more filters for eth. See the below screenshot.
Check the Wireshark website for all available filters. Here is the direct link
https://www.wireshark.org/docs/man-pages/wireshark-filter.html
You can also check these links
https://linuxhint.com/filter_by_port_wireshark/
https://linuxhint.com/filter_by_ip_wireshark/
Identify a large amount of traffic being used and what protocol it’s using:
We can take help from Wireshark inbuilt option and find out which protocol packets are more. This is required because when there are millions of packets inside a capture, and also size is huge, it will be difficult to scroll through every packet.
Step 1:
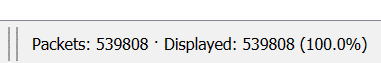
First of all, the total number of packets in the capture file is shown at right bottom side
See below screenshot
Step 2:
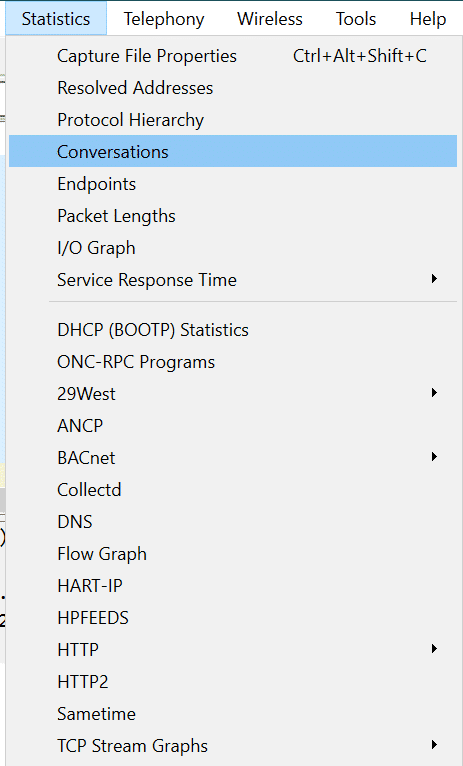
Now go to Statistics->Conversations
See below screenshot
Now the output screen will be like this
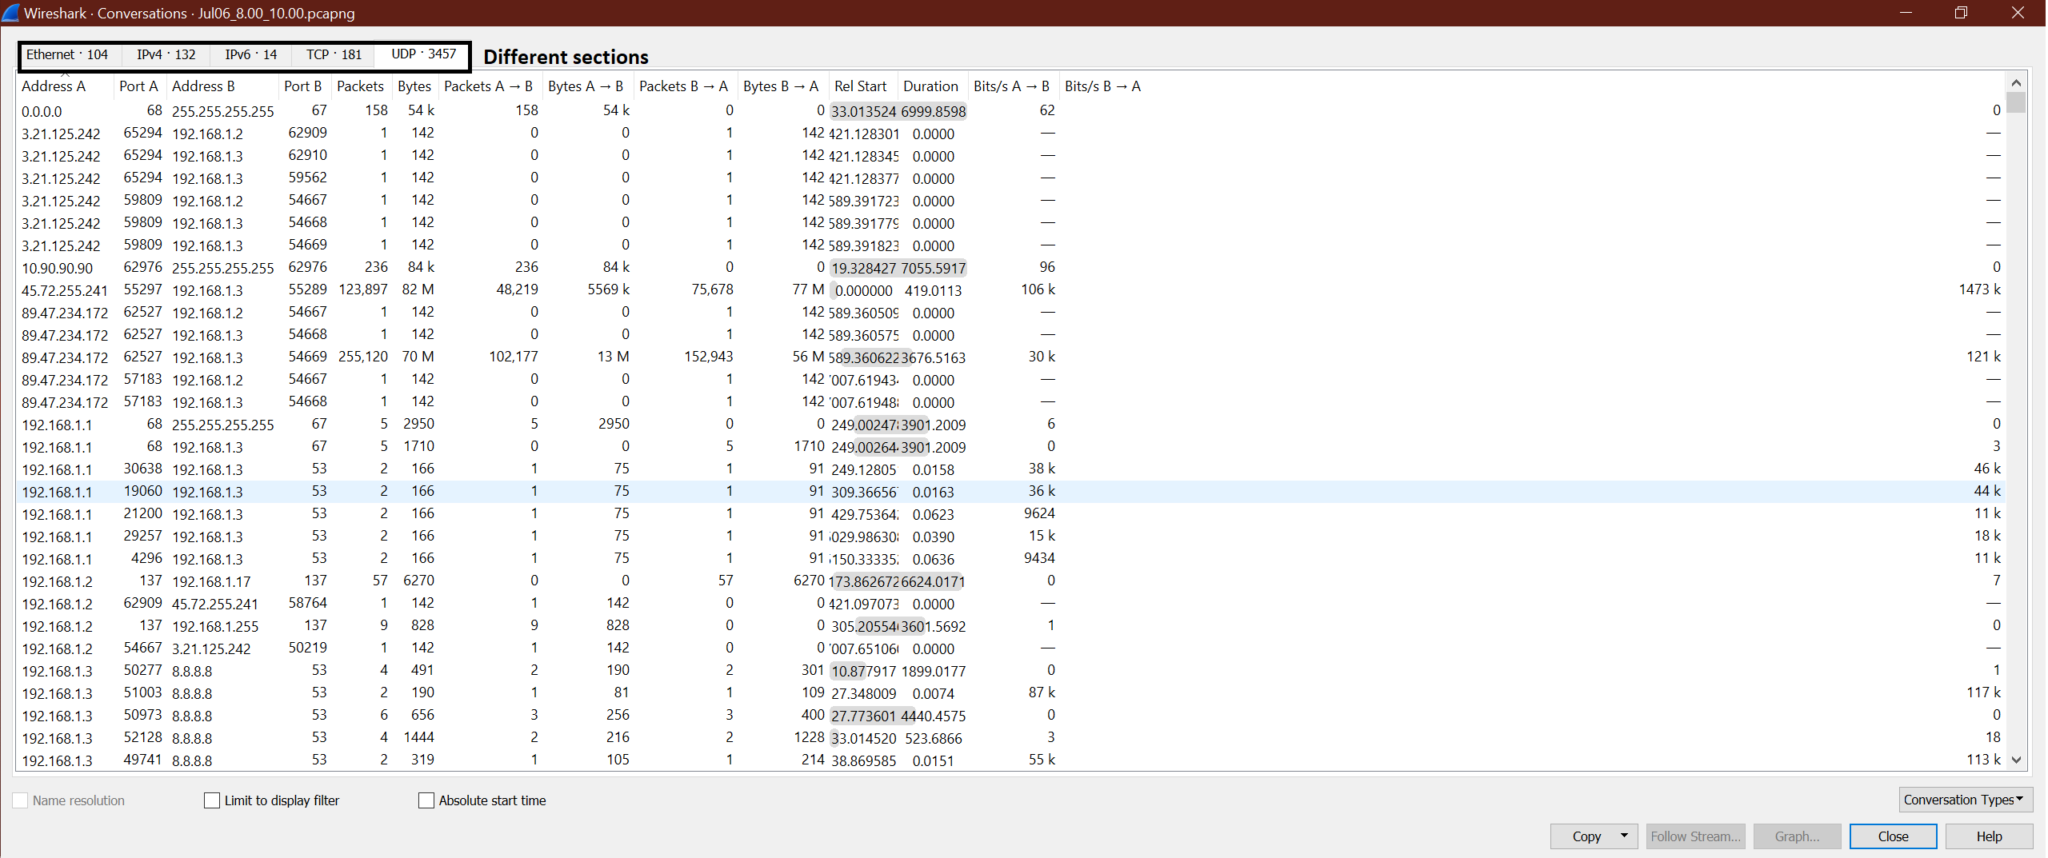
Step 3:
Now let’s say we want to find out who (IP address) exchanges maximum packets under UDP. So, go to UDP->Click on Packets so that the max packet is displayed on top.
Look at the screenshot.

We can get the source and destination IP address, which exchanges maximum UDP packets. Now the same steps can be used for other protocol TCP also.
Follow TCP Streams to see the full conversation
To see full TCP conversations, follow the below steps. This will be helpful when we want to see what happens for one particular TCP connection.
Here are the steps.
Step1:
Right-click on TCP packet in Wireshark like below screenshot
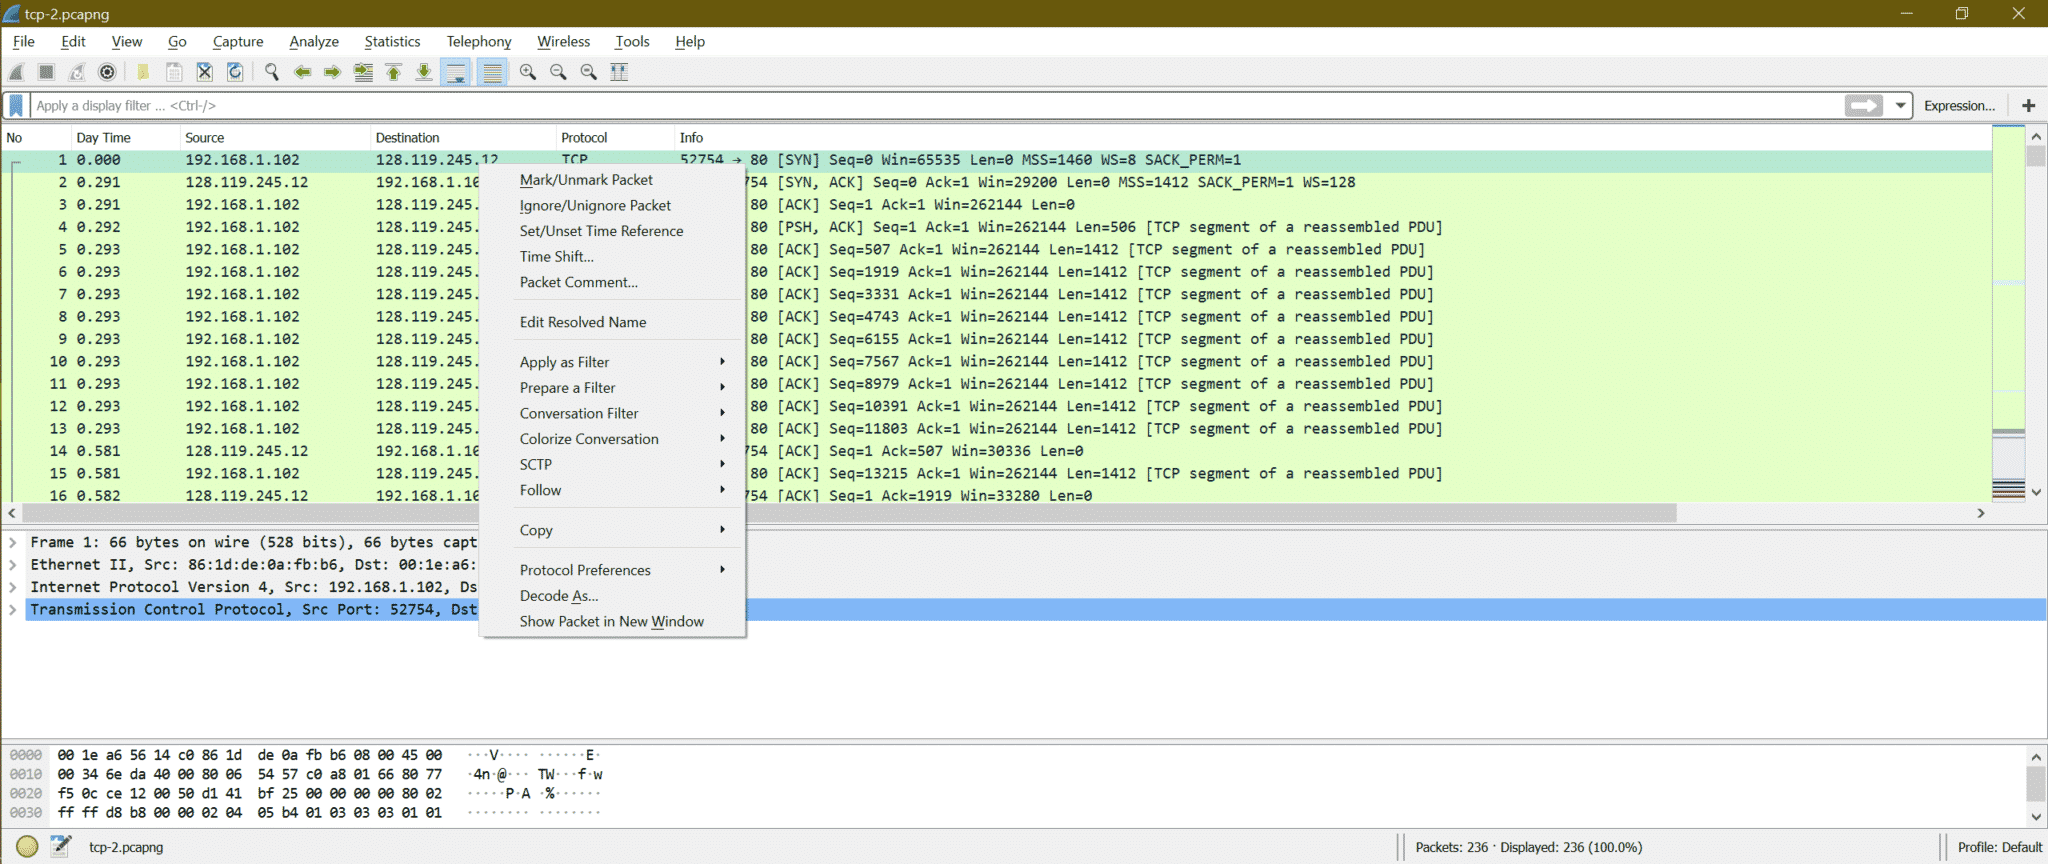
Step2:
Now go to Follow->TCP Stream

Step3:
Now one new window will be opened showing the conversations. Here is the screenshot
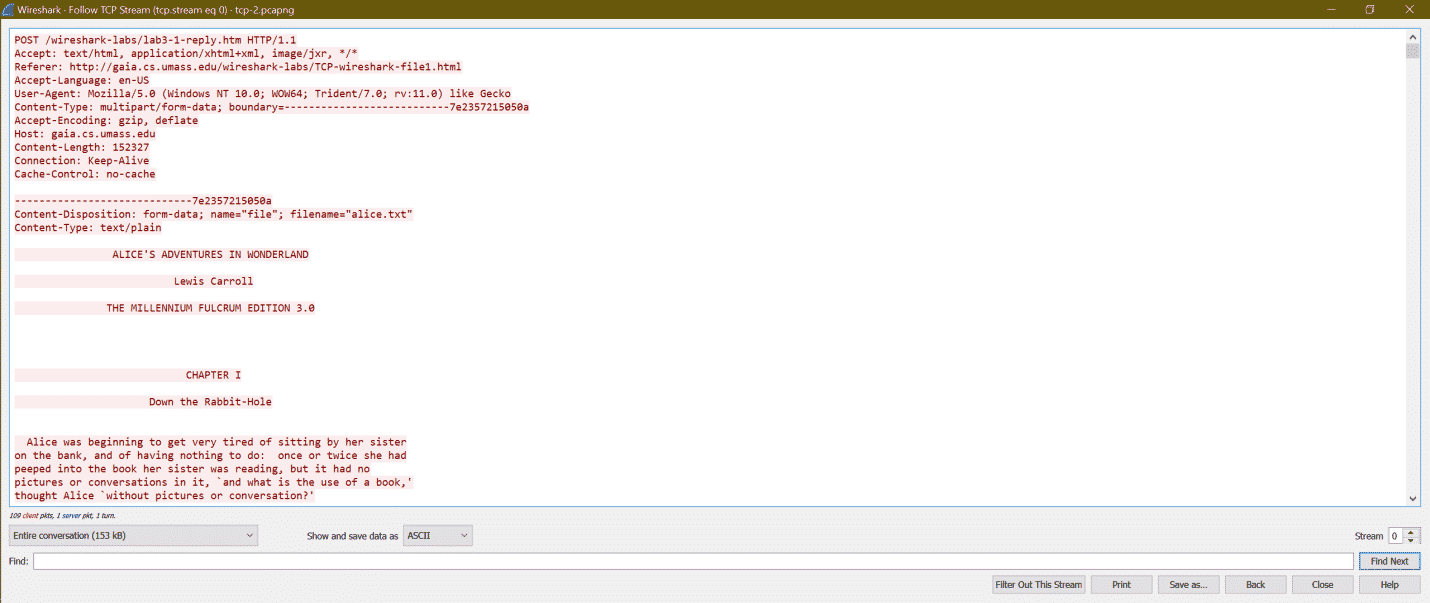
Here we can see HTTP header information and then the content
POST /wireshark-labs/lab3-1-reply.htm HTTP/1.1
Accept: text/html, application/xhtml+xml, image/jxr, */*
Referer: http://gaia.cs.umass.edu/wireshark-labs/TCP-wireshark-file1.html
Accept-Language: en-US
User-Agent: Mozilla/5.0 (Windows NT 10.0; WOW64; Trident/7.0; rv:11.0) like Gecko
Content-Type: multipart/form-data; boundary=---------------------------7e2357215050a
Accept-Encoding: gzip, deflate
Host: gaia.cs.umass.edu
Content-Length: 152327
Connection: Keep-Alive
Cache-Control: no-cache
||-----Content-----||
ontent-Disposition: form-data; name="file"; filename="alice.txt"
Content-Type: text/plain
ALICE'S ADVENTURES IN WONDERLAND
Lewis Carroll
THE MILLENNIUM FULCRUM EDITION 3.0
CHAPTER I
Down the Rabbit-Hole
Alice was beginning to get very tired of sitting by her sister
on the bank, and of having nothing to do: once or twice she had
peeped into the book her sister was reading, but it had no
pictures or conversations in it, `and what is the use of a book,'
thought Alice `without pictures or conversation?'
…..Continue…………………………………………………………………………………
Now let’s go through some famous networking attacks through Wireshark, understand the pattern of different networking attacks.
Network Attacks:
Network attack is a process to gain access to other network systems and then steal data without knowledge of the victim or inject malicious code, which makes the victim’s system into a mess. In the end, the target is to steal data and make use of it with a different purpose.
There are many types of networking attacks, and here we are going to discuss some of the important networking attacks. We have chosen below attacks such a way that we can cover different types of patterns of attack.
A. Spoofing/ Poisoning Attack (Example: ARP spoofing, DHCP spoofing, etc.)
B. Port Scan Attack (Example: Ping sweep, TCP Half-open, TCP full connect scan, TCP null scan, etc.)
C. Brute force Attack (Example: FTP username and password, POP3 password cracking)
D. DDoS Attack (Example: HTTP flood, SYN flood, ACK flood, URG-FIN flood, RST-SYN-FIN flood, PSH flood, ACK-RST flood)
E. Malware Attacks (Example: ZLoader, Trojans, Spyware, Virus, Ransomware, Worms, Adware, Botnets, etc.)
A. ARP Spoofing:
What is ARP Spoofing?
ARP spoofing is also known as ARP poisoning as an attacker, makes the victim update ARP entry with attacker MAC address. It’s like adding poison to correct ARP entry. ARP spoofing is a networking attack that allows the attacker to divert the communication between network hosts. ARP spoofing is one of the methods for Man in the middle attack( MITM).
Diagram:
This is the expected communication between Host and Gateway
This is the expected communication between Host and Gateway when the network is under attack.
Steps of ARP Spoofing Attack:
Step1: The attacker chooses one network and starts sending broadcast ARP requests to the sequence of IP addresses.
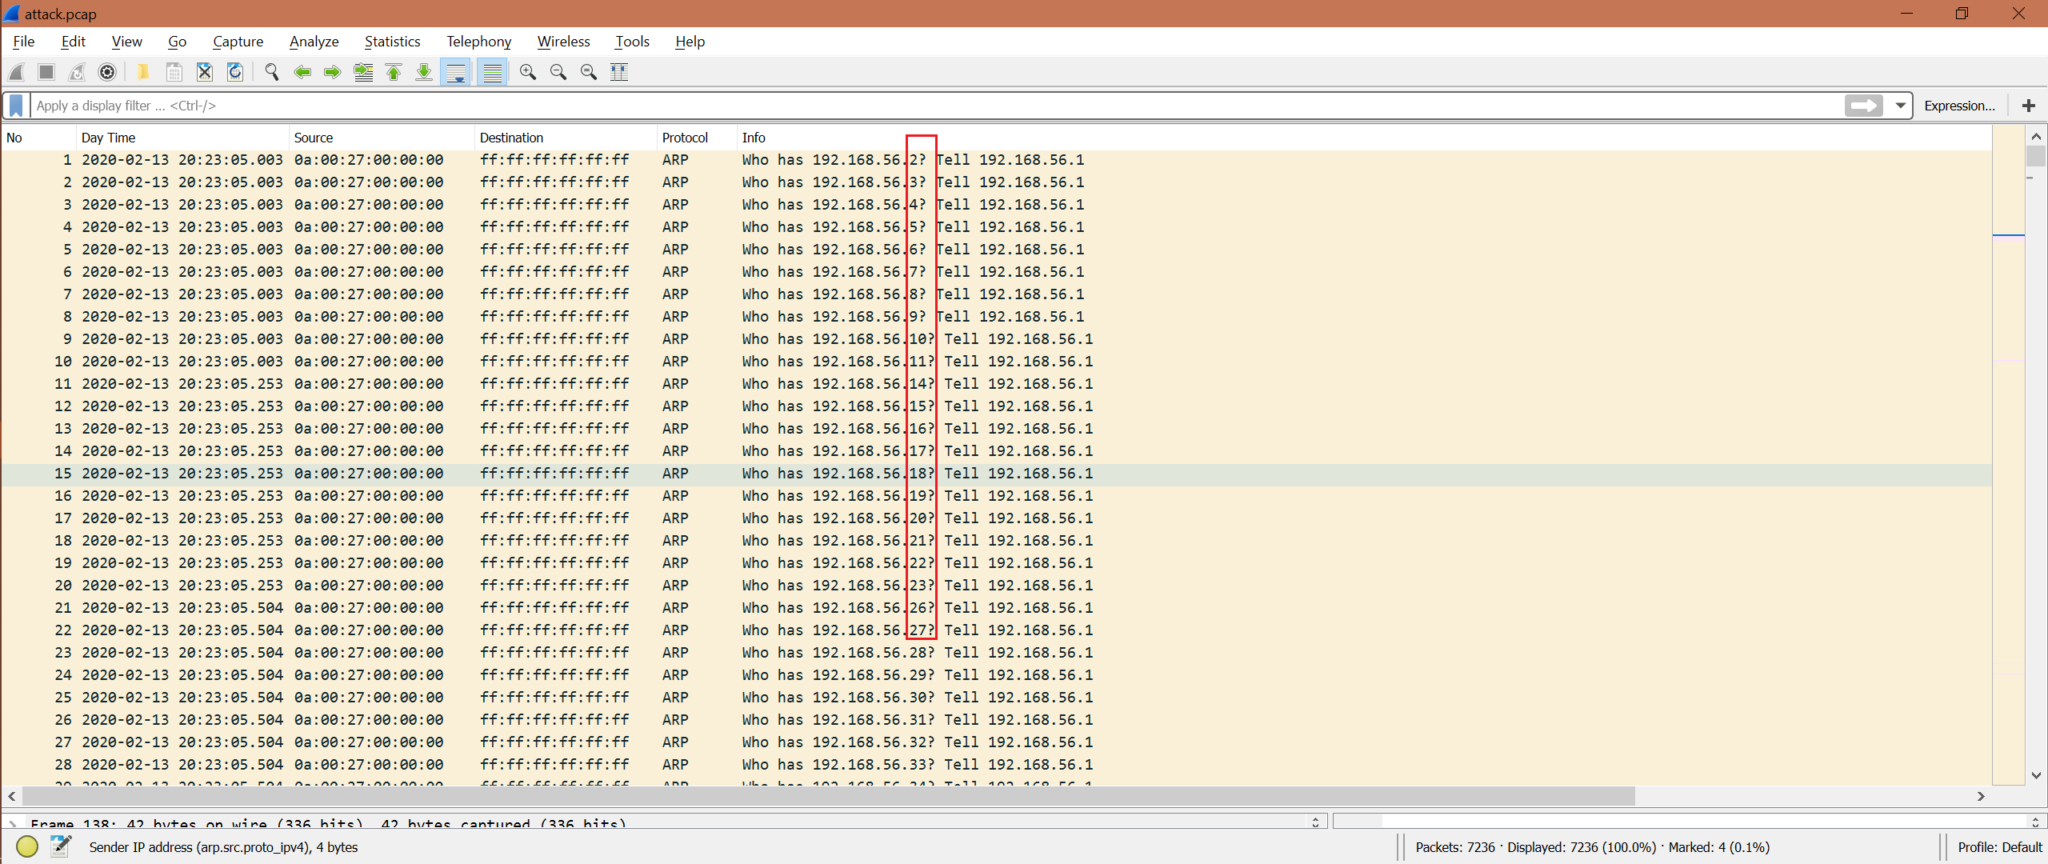
Step2: Attacker checks for any ARP reply.

Step3: If an attacker gets any ARP reply, then the attacker sends the ICMP request to check the reachability to that host. Now the attacker has the MAC address of these hosts whoever sent ARP reply. Also, the host who has sent ARP reply updates its ARP cache with the attacker IP and MAC assuming that that is the real IP and MAC address.
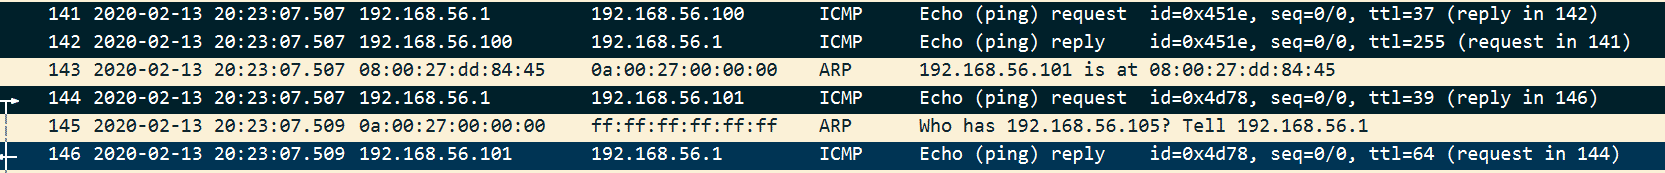
Now from the screenshot, we can say any data comes from 192.168.56.100 or 192.168.56.101 to IP 192.168.56.1 will reach to attacker MAC address, which is claiming as ip address 192.168.56.1.
Step4: After ARP spoofing, there may be multiple attacks like Session hijack, DDoS attack. ARP spoofing is just the entry.
So, you should look for these above patterns to get hints of the ARP spoofing attack.
How to avoid it?
- ARP spoofing detection and prevention software.
- Use HTTPS instead of HTTP
- Static ARP entries
- VPNS.
- Packet filtering.
B. Identify Port Scan attacks with Wireshark:
What is Port scanning?
Port scanning is a type of networking attack where attackers start sending a packet to different port numbers to detect the status of the port if it’s open or closed or filtered by a firewall.
How to detect Port scanning in Wireshark?
Step1:
There are many ways to look into Wireshark captures. Suppose we observe that there are contentious multiple SYN or RST packet in captures. Wireshark Filter: tcp.flags.syn == 1 or tcp.flags.reset == 1
There is another way to detect it. Go to Statistics->Conversions->TCP [Check Packet Column].
Here we can see so many TCP communications with different ports [Look at Port B], but packet numbers are only 1/2/4.
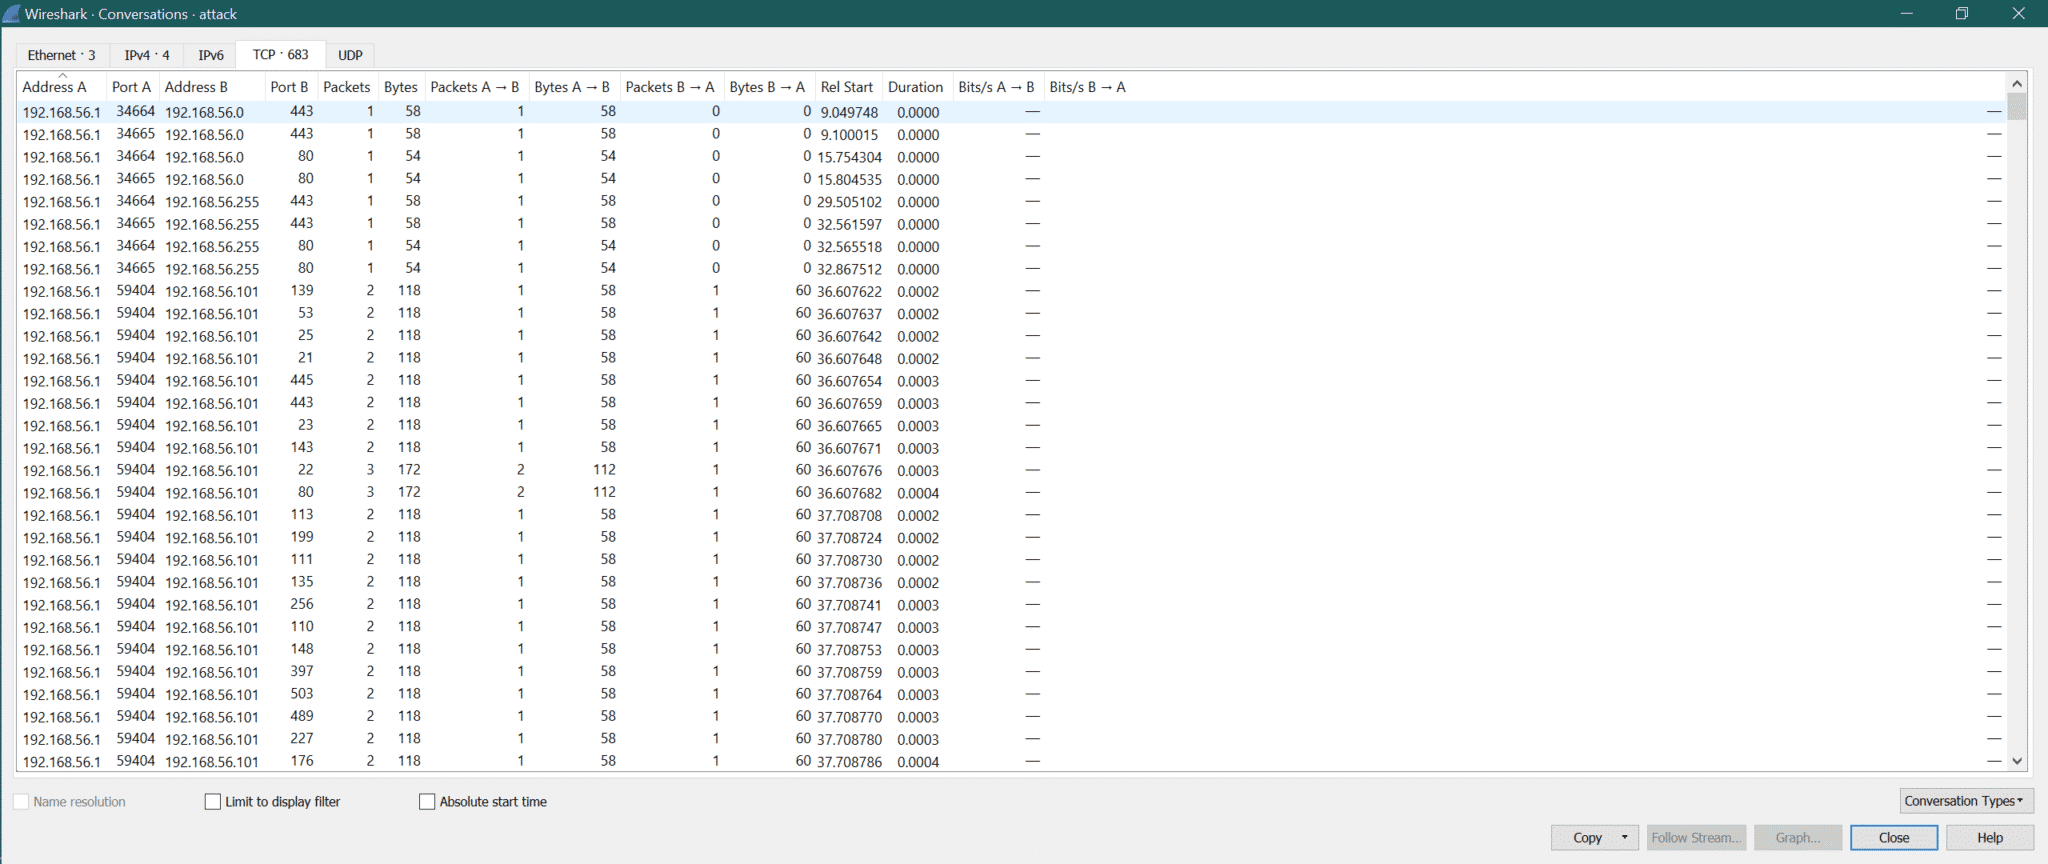
Step2:
But there is no TCP connection observed. Then it’s a sign of port scan.
Step3:
From below capture, we can see SYN packets were sent to port numbers 443, 139, 53, 25, 21, 445, 23, 143, 22, 80. As some of the ports [139, 53, 25, 21, 445, 443, 23, 143] were closed so attacker [192.168.56.1] received RST+ACK. But the attacker received SYN+ACK from port 80 (packet number 3480) and 22 (packet number 3478). This means port 80 and 22 are opened. Bu attacker was not interested in TCP connection it sent RST to port 80 (packet number 3479) and 22 (packet number 3479)
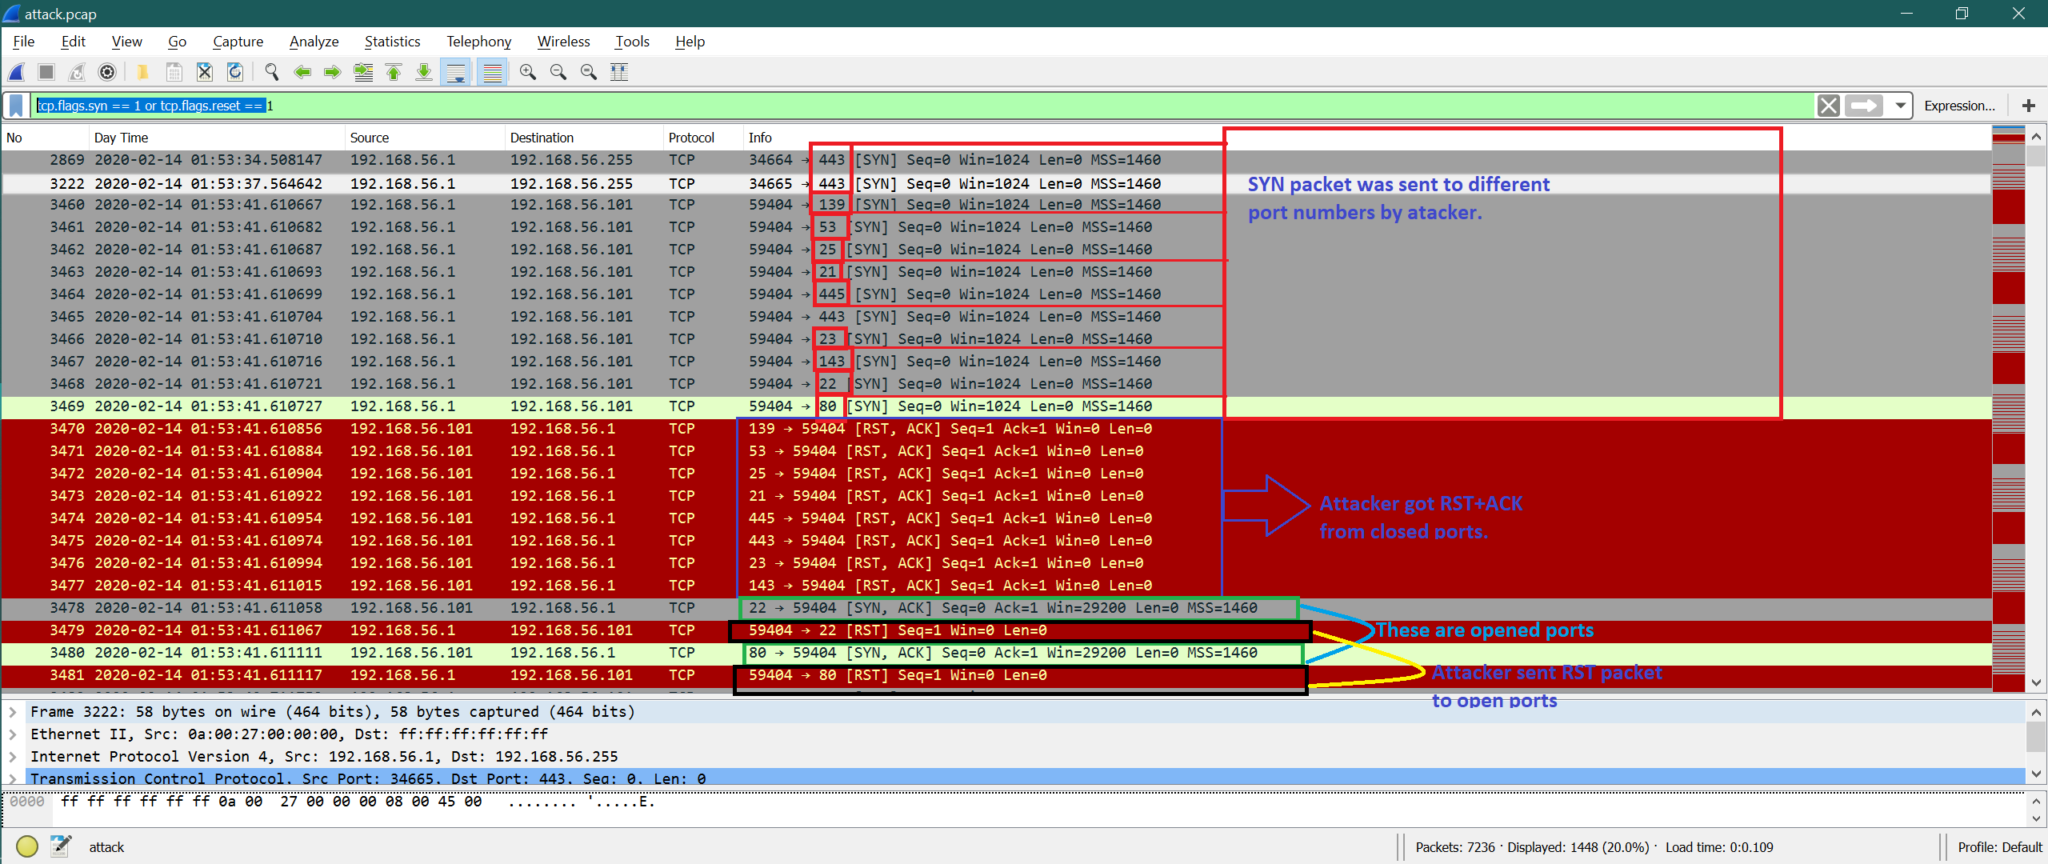
Note that: Attacker can go for TCP 3-way handshake (Shown below), but after that attacker terminates the TCP connection. This is called a TCP full connect scan. This is also one type of port scan mechanism instead of a TCP half-open scan like discussed above.
1. The attacker sends SYN.
2. The victim sends SYN+ACK.
3. Attacker sends ACK
How to avoid it?
You can use a good firewall and intrusion prevention system (IPS). The firewall helps to control ports about its visibility, and IPS can monitor if any port scan is in progress and block the port before anyone gets full access to the network.
C. Brute force Attack:
What is the Brute Force Attack?
Brute Force Attack is a networking attack where the attacker tries a different combination of credentials to break any website or system. This combination may be a user name and password or any information that allows you to enter to system or website. Let’s have one simple example; we often use a very common password like password or password123, etc., for common usernames like admin, user, etc. So if the attacker makes some combination of username and password, this type of system can be easily breakable. But this is one simple example; things can go for a complex scenario also.
Now, we will take one scenario for File Transfer Protocol (FTP) where username and password are used to login. So, the attacker can try multiple usernames and password combinations to get into the ftp system. Here is the simple diagram for FTP.
Diagram for Brute Force Attchl for FTP Server:
FTP Server
Multiple wrong login attempts to FTP Server
One successful login attempt to FTP server
From the diagram, we can see that attacker tried multiple combinations of FTP usernames and passwords and got success after sometime.
Analysis on Wireshark:
Here is the whole capture screenshot.
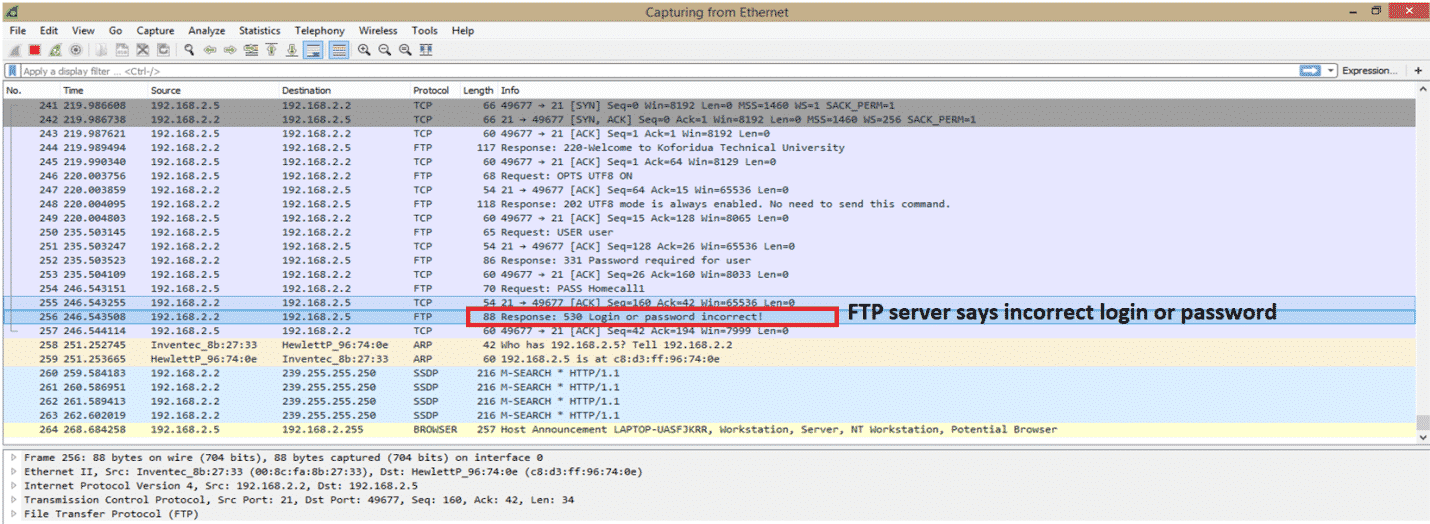
This is just starting of capture, and we just highlighted one error message from the FTP server. An error message is “Login or password incorrect”. Before the FTP connection, there is a TCP connection, which is expected, and we are not going to details on that.
To see if there is more than one login fail message, we can tale the help of Wireshark filer “ftp.response.code==530” which is the FTP response code for login failure. This code is highlighted in the previous screenshot. Here is the screenshot after using the filter.
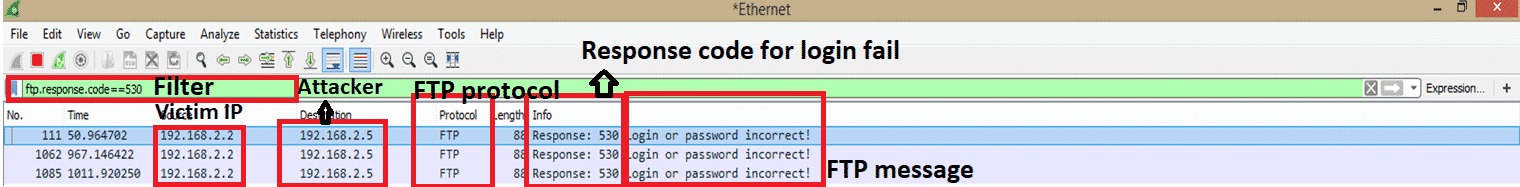
As we can see, there are a total of 3 failed login attempts to the FTP server. This indicates there was a Brute Force Attack on the FTP server. One more point to remember that attackers may use botnet, where we will see many different IP addresses. But here for our example, we see only one IP address 192.168.2.5.
Here are the points to remember to detect Brute Force Attack:
1. Login failure for one IP address.
2. Login failure for multiple IP addresses.
3. Login failure for an alphabetically sequential username or password.
Types of Brute Force Attack:
1. Basic brute force attack
2. Dictionary attack
3. Hybrid brute force attack
4. Rainbow table attack
Is the above scenario, we have observed the “Dictionary attack” for cracking the FTP server username and password?
Popular tools used for brute force attack:
1. Aircrack-ng
2. John, the ripper
3. Rainbow crack
4. Cain and Abel
How to avoid Brute Force Attack?
Here are some points for any website or ftp or any other network system to avoid this attack.
1. Increase password length.
2. Increase password complexity.
3. Add Captcha.
4. Use two-factor authentications.
5. Limit login attempts.
6. Lock any user if the user crosses the number of failed login attempts.
D. Identify DDOS attacks with Wireshark:
What is DDOS Attack?
A distributed denial-of-service (DDoS) attack is a process to block legitimate network devices to get the services from the server. There may be many types of DDoS attacks like HTTP flood (Application Layer), TCP SYN (Transport Layer) message flood, etc.
Example Diagram of HTTP Flood:
HTTP SERVER
Client Attacker IP
Client Attacker IP
Legitimate Client sent HTTP GET Request
|
|
|
Client Attacker IP
From the above diagram, we can see the Server receives many HTTP requests, and the server gets busy in service of those HTTP requests. But when a legitimate client sends an HTTP request, the server is unavailable to reply to the client.
How to Identify HTTP DDoS attack in Wireshark:
If we open a capture file, there are many HTTP requests (GET/POST, etc.) from different TCP source port.
Used filter: “http.request.method == “GET”
Let’s see the captured screenshot to understand it better.

From the screenshot, we can see attacker ip is 10.0.0.2, and it has sent multiple HTTP requests using different TCP port numbers. Now server got busy sending HTTP reply for all those HTTP requests. This is the DDoS attack.
There are many types of DDoS attacks using different scenarios like SYN flood, ACK flood, URG-FIN flood, RST-SYN-FIN flood, PSH flood, ACK-RST flood, etc.
Here is the screenshot for the SYN flood to the server.
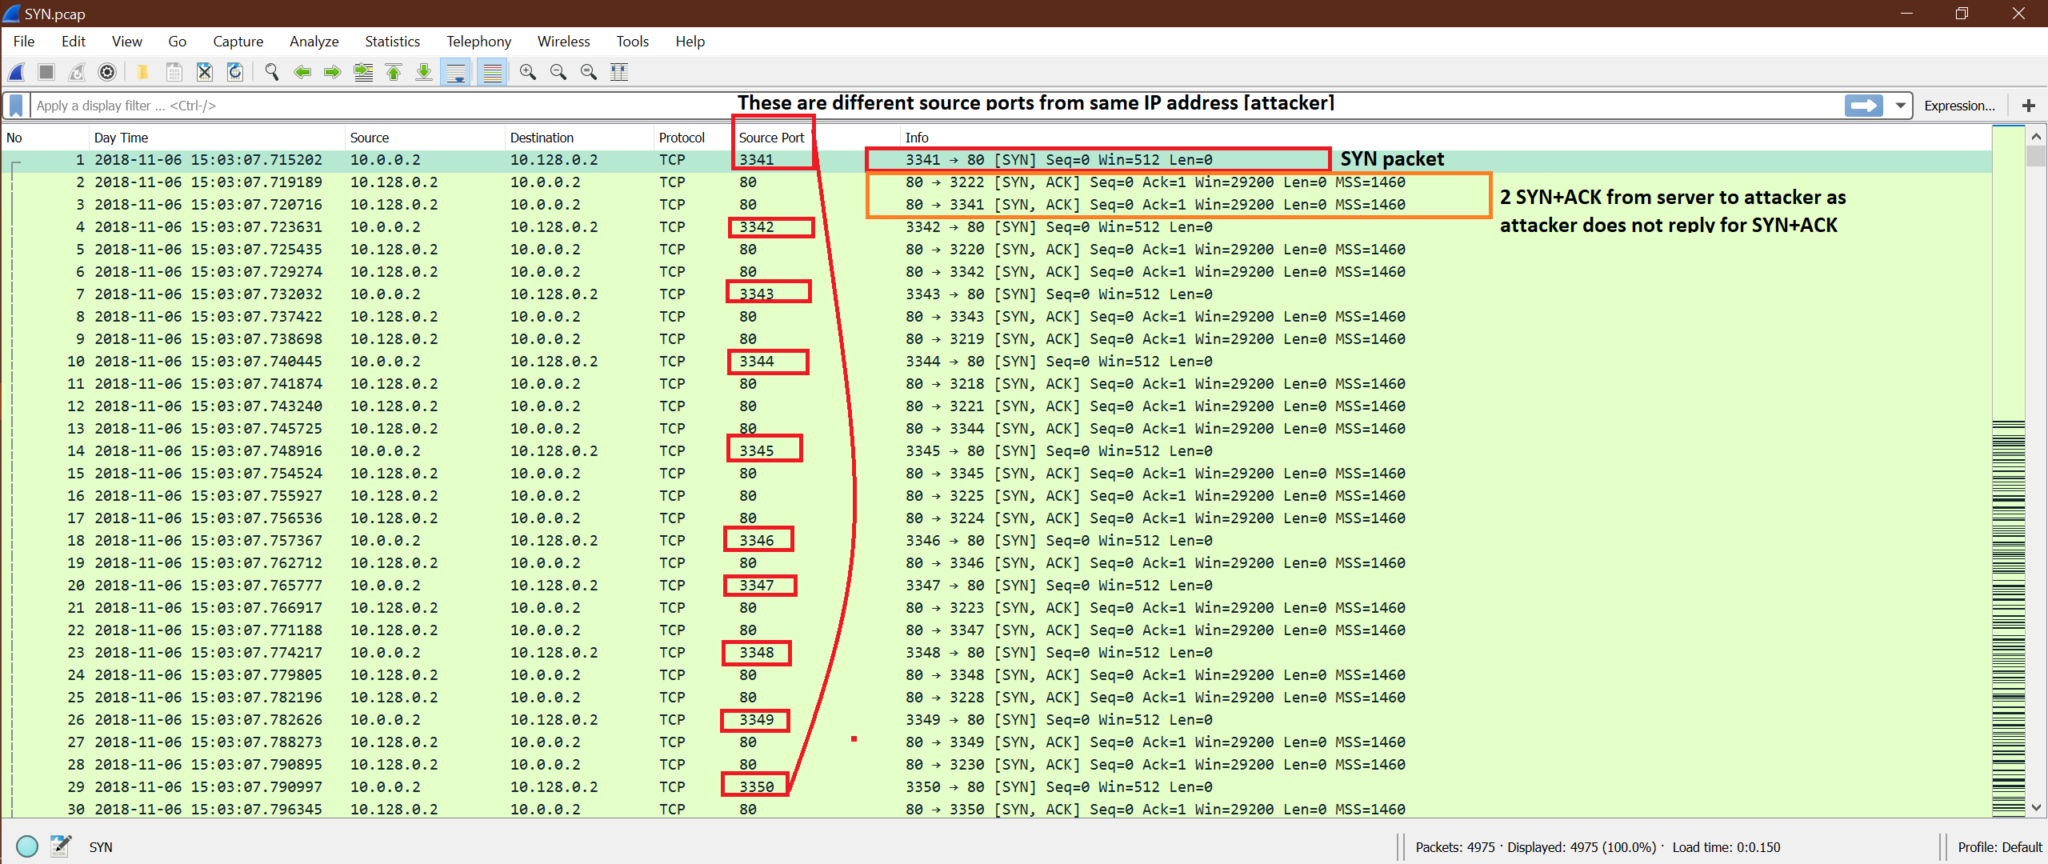
Note that: The basic pattern of DDoS attack is there will be multiple packets from the same IP or different IP using different ports to the same destination IP with high frequency.
How to stop the DDoS attack:
1. Immediately report to the ISP or Hosting provider.
2. Use the Windows firewall and contact your host.
3. Use DDoS detection software or routing configurations.
E. Identify Malware attacks with Wireshark?
What is Malware?
Malware words came from Malicious Software. We can think of Malware as a piece of code or software that is designed to do some damage on systems. Trojans, Spyware, Viruses, ransomware are different types of malware.
There are many ways malware gets into the system. We will take one scenario and try to understand it from Wireshark capture.
Scenario:
Here in example capture, we have two windows systems with IP address as
10.6.12.157 and 10.6.12.203. These hosts are communicating with the internet. We can see some HTTP GET, POST, etc. operations. Let’s find out which windows system got infected, or both got infected.
Step1:
Let’s see some HTTP communication by these hosts.
After using the below the filter, we can see all HTTP GET request in the capture
“http.request.method == “GET””
Here is the screenshot to explain the content after the filter.
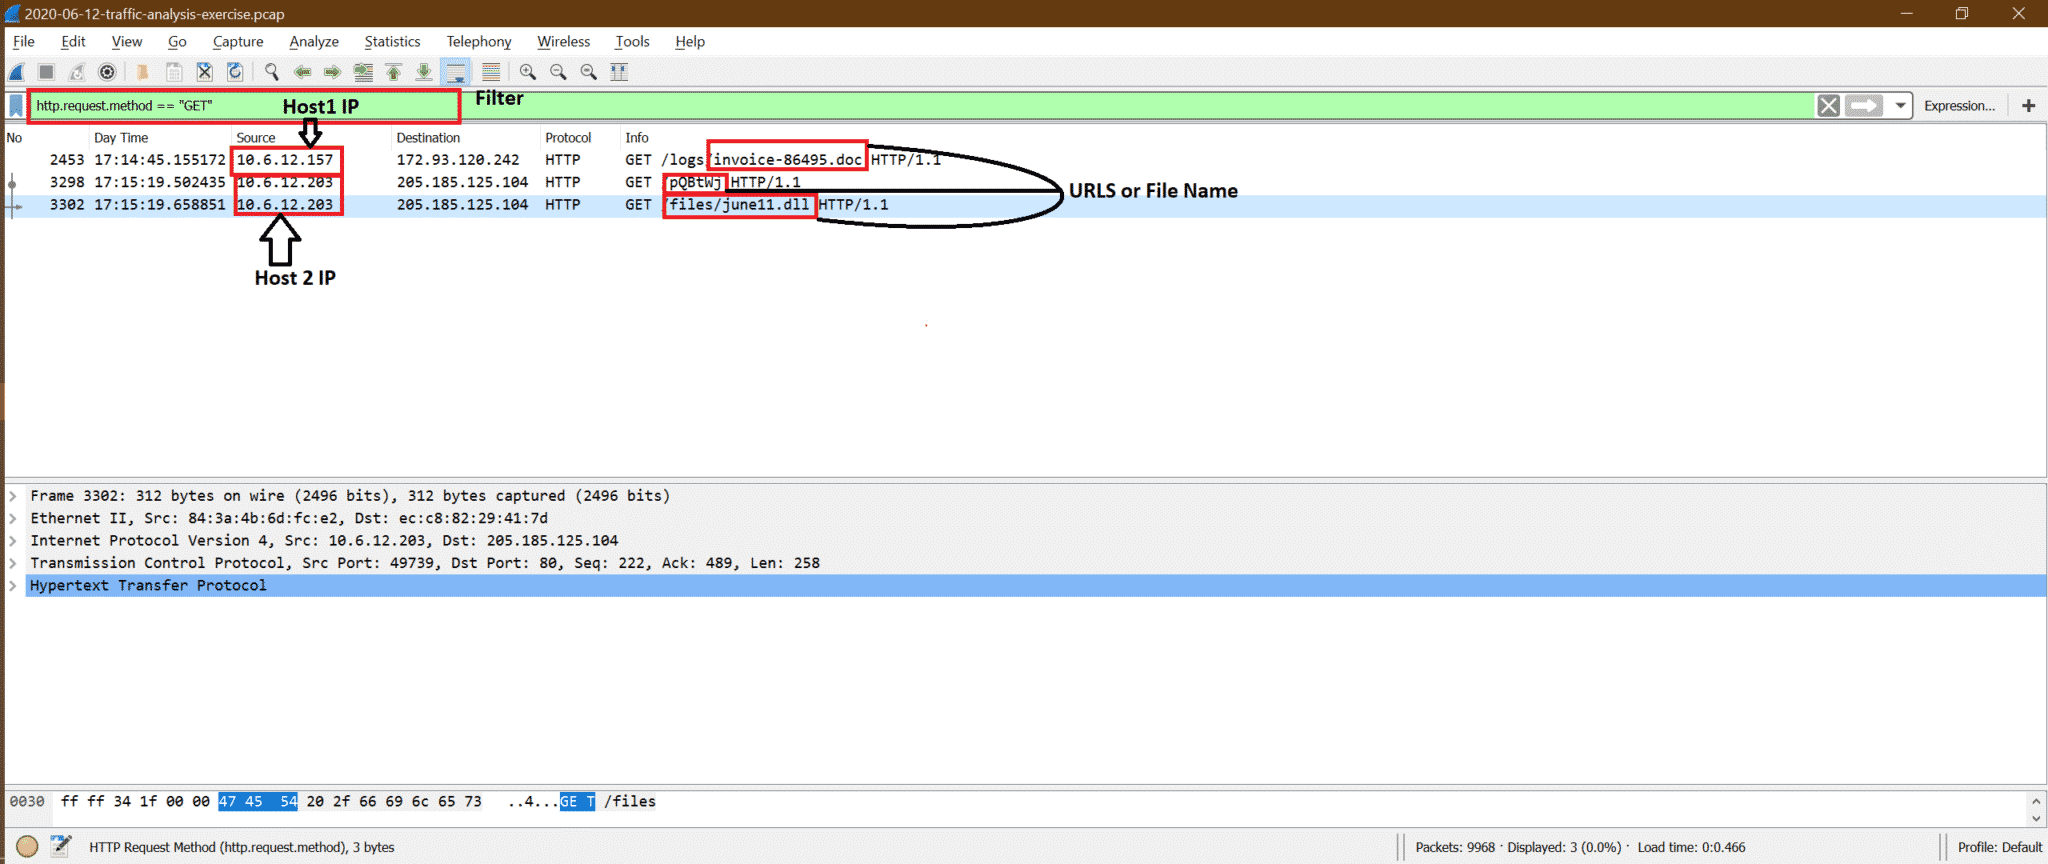
Step2:
Now out of these, the suspicious one is GET request from 10.6.12.203, so we can follow TCP stream [see below screenshot] to find out the more clearly.

Here are the findings from following TCP stream
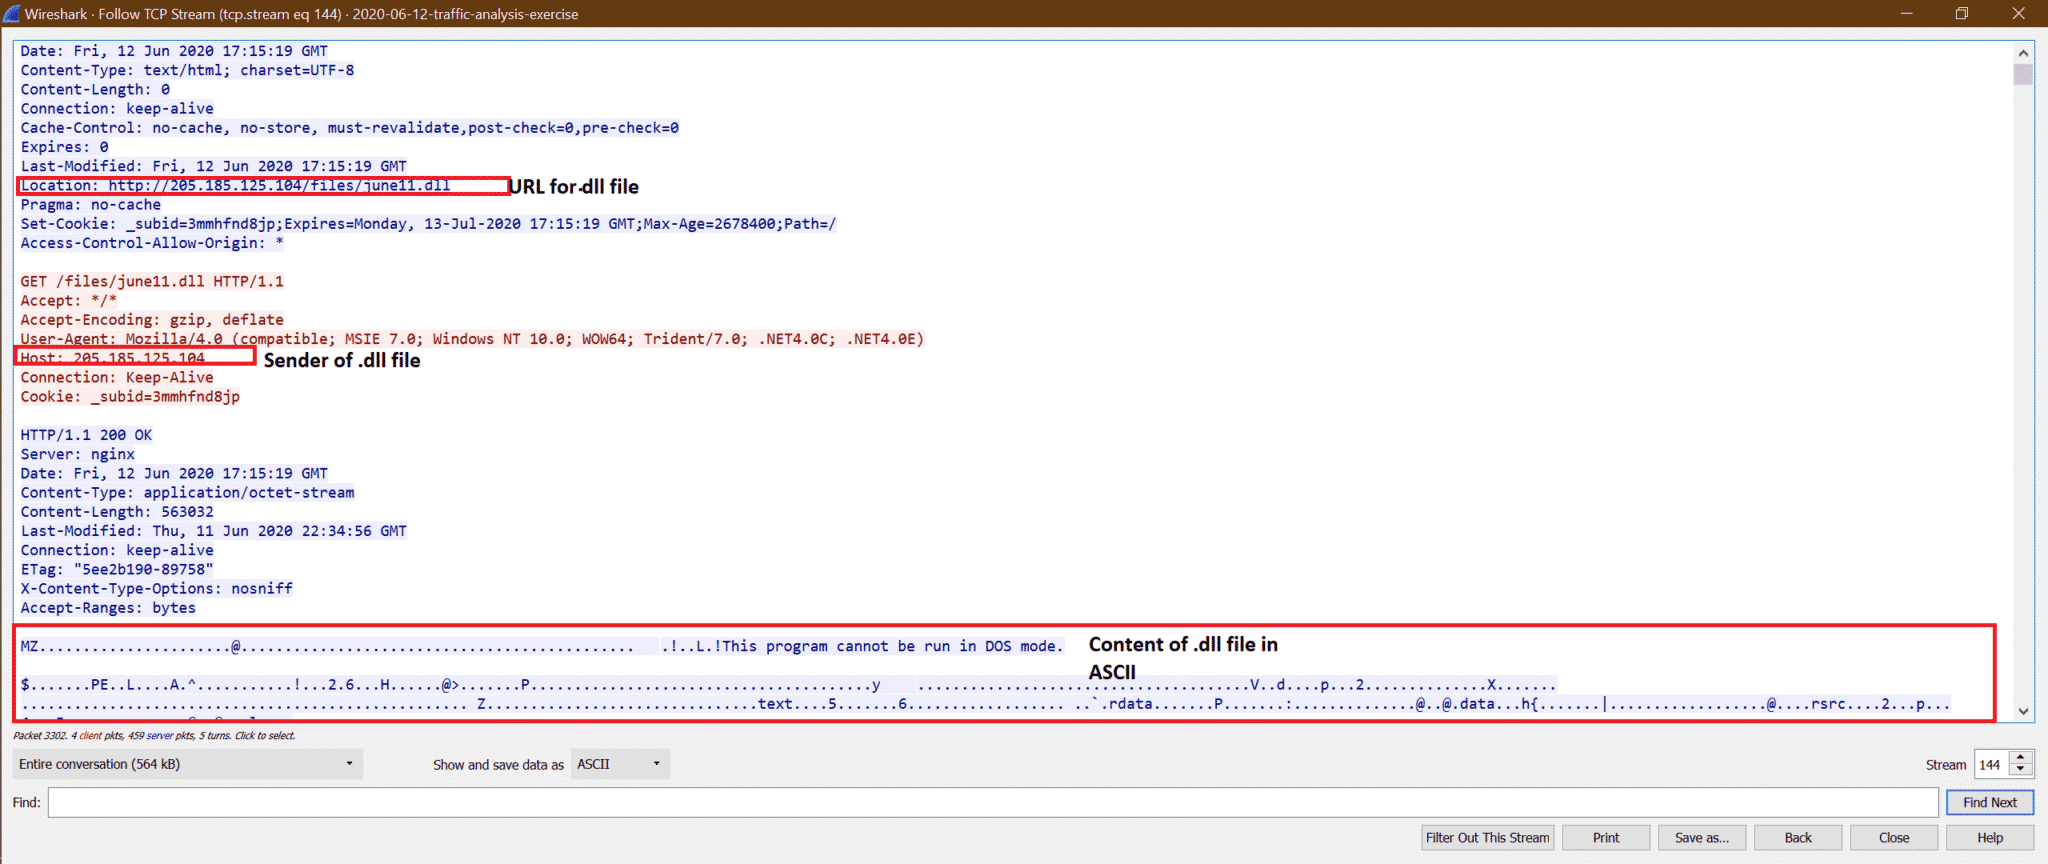
Step3:
Now we can try exporting this june11.dll file from pcap. Follow the below screenshot steps
a.
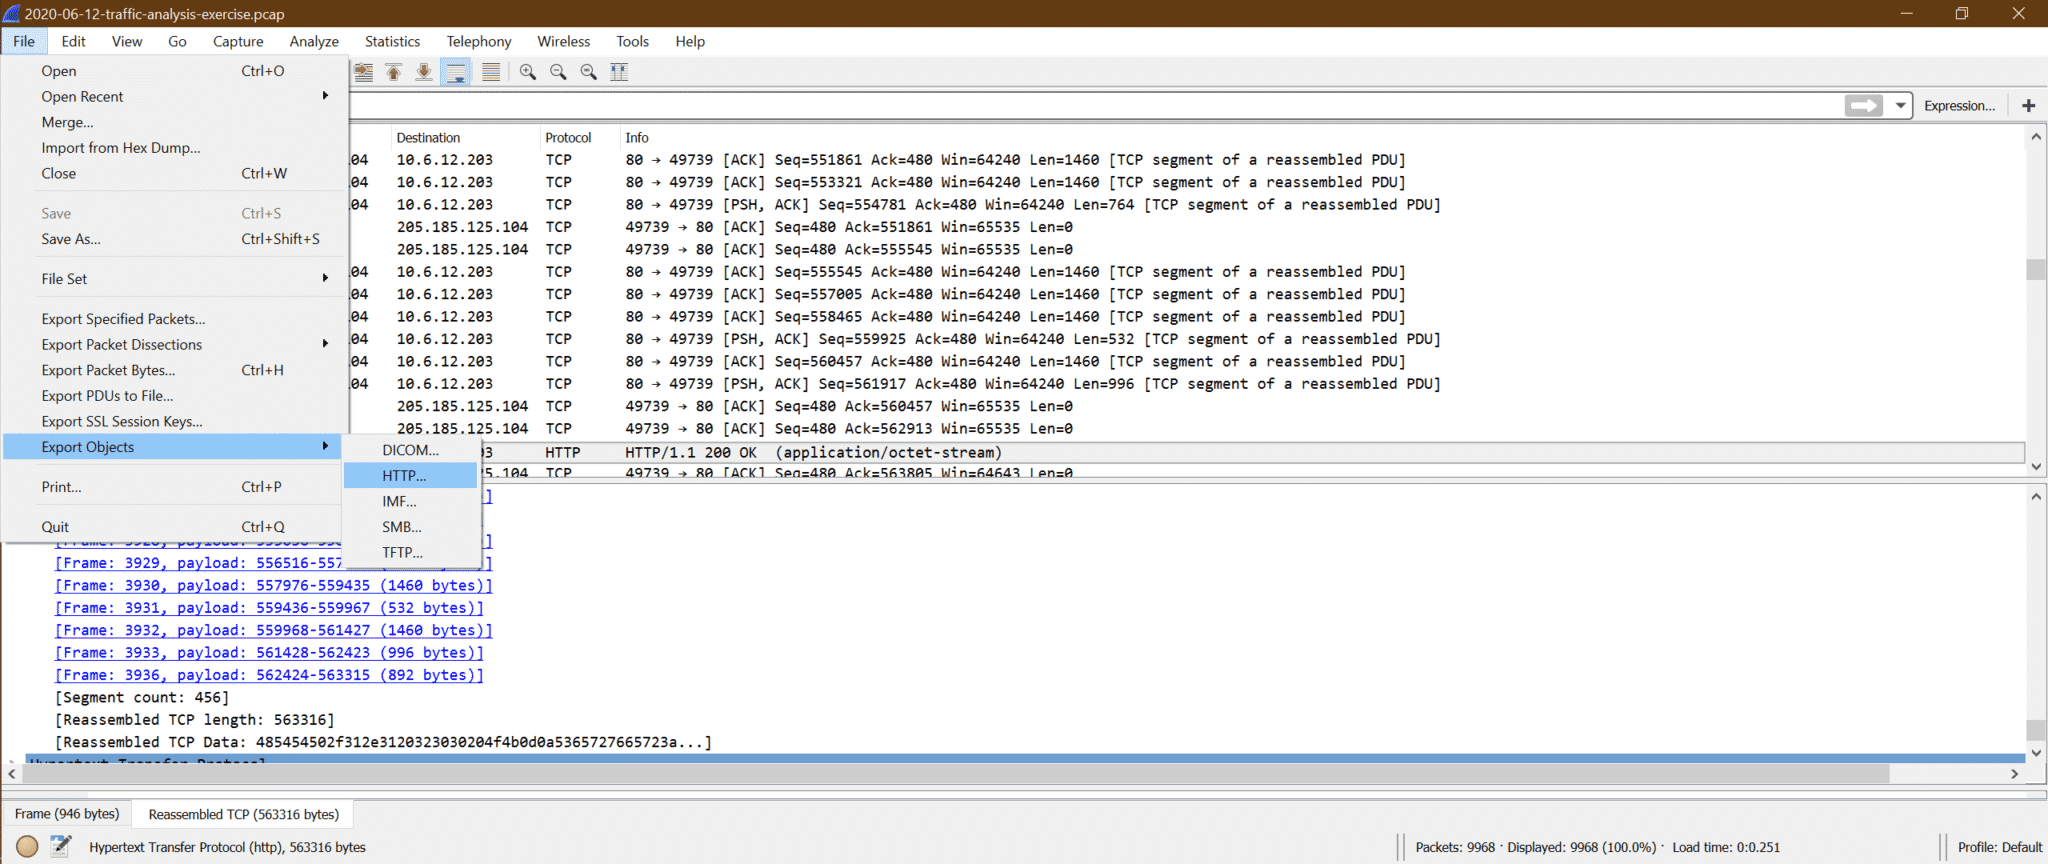
b.
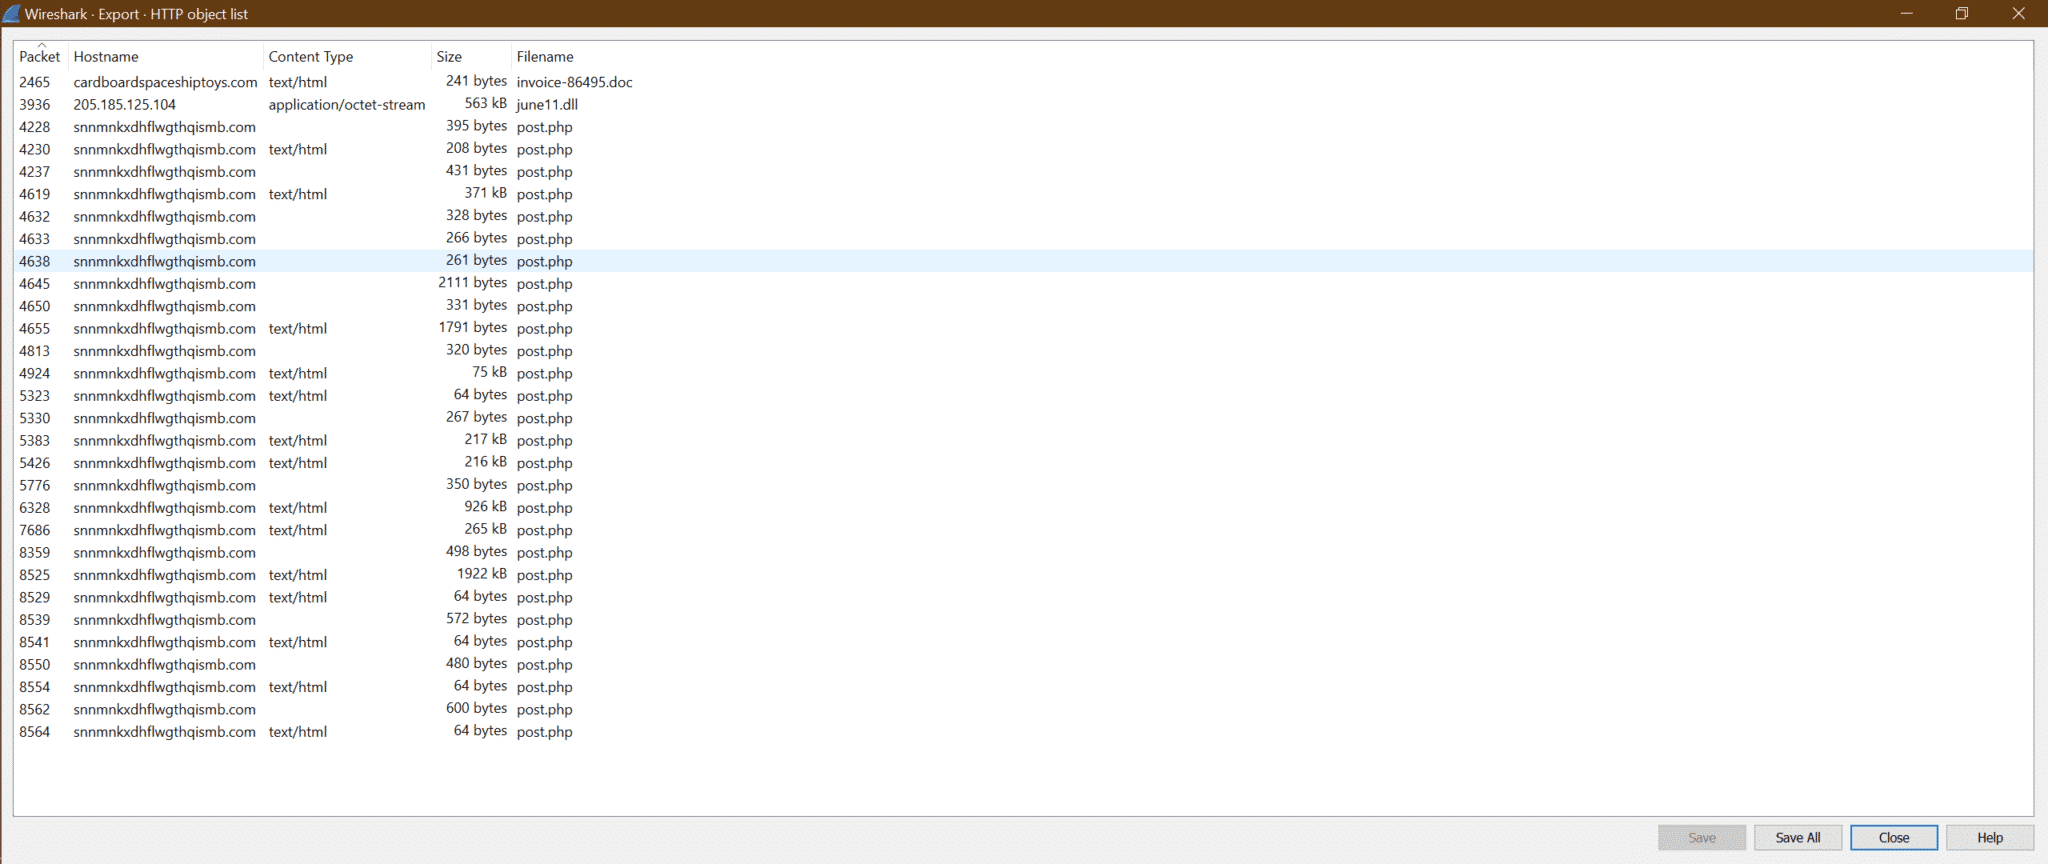
c. Now click on Save All and select destination folder.
d. Now we can upload june11.dll file to virustotal site and get the output as below
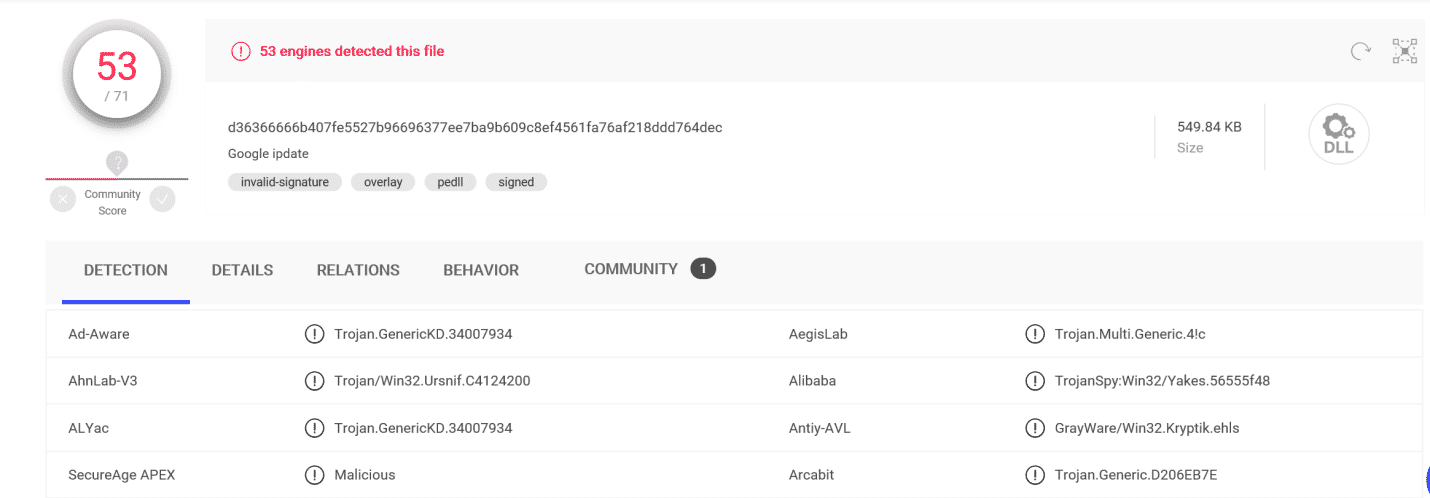
This confirms that june11.dll is a malware that got downloaded to the system [10.6.12.203].
Step4:
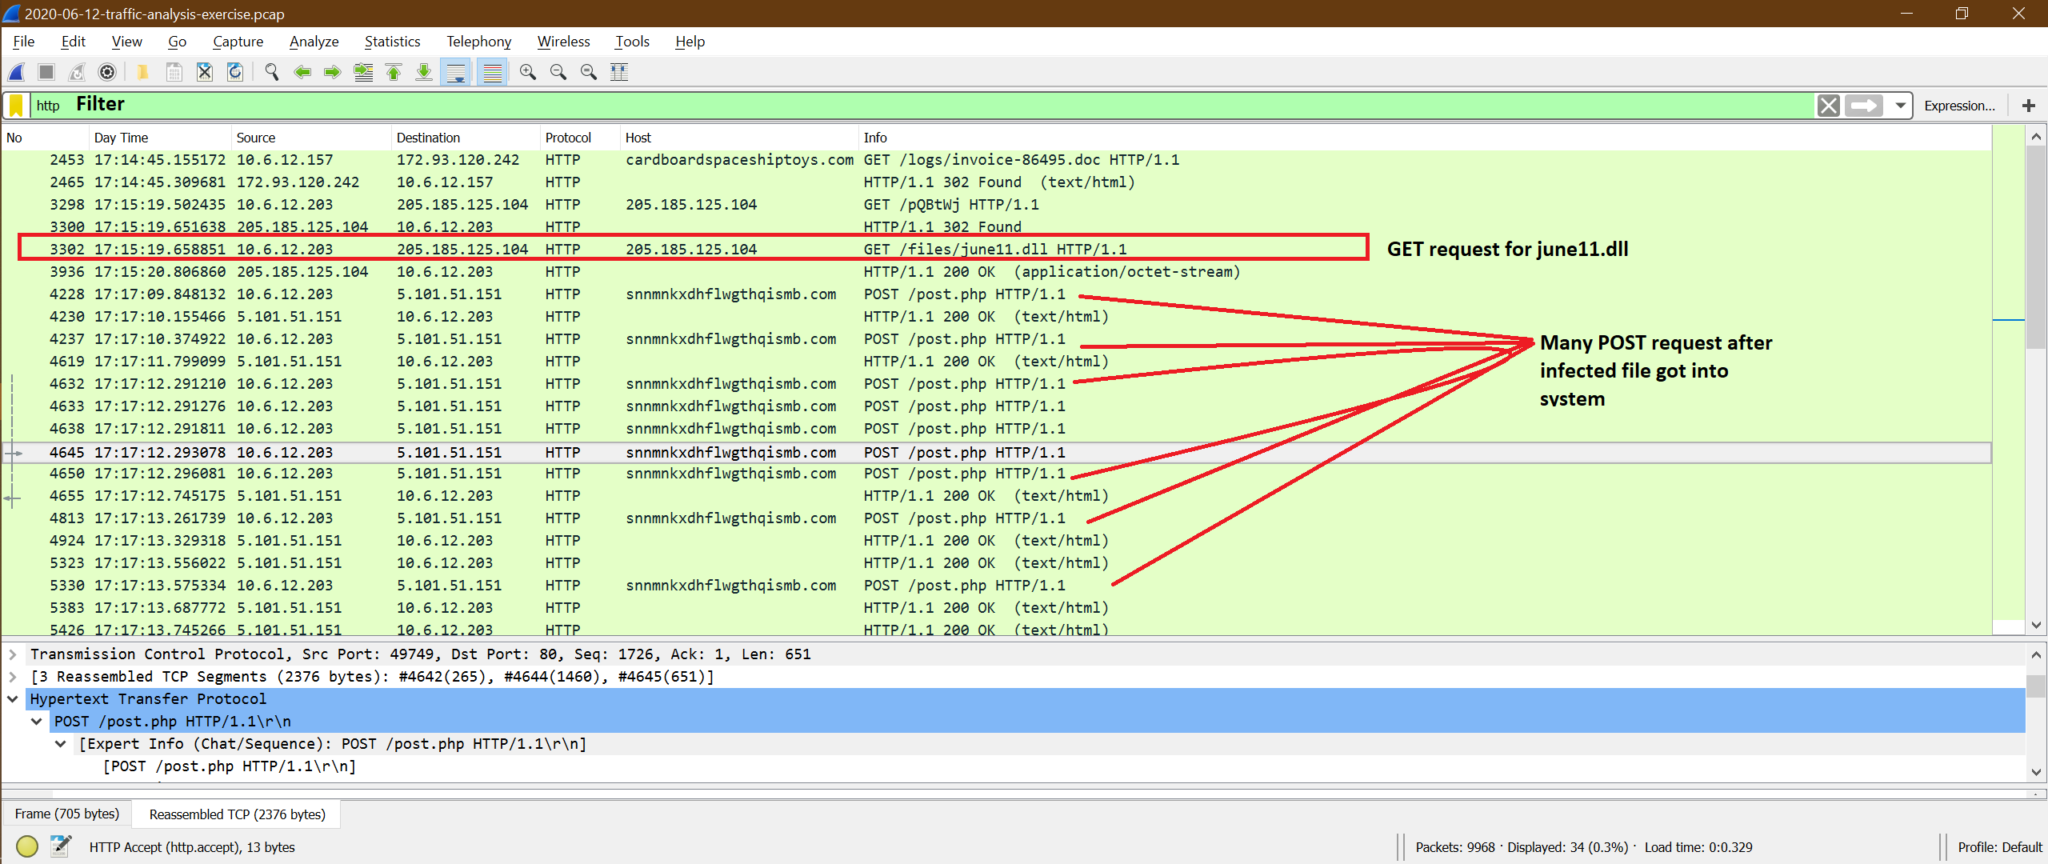
We can use the below filter to see all http packets.
Used Filter: “http”
Now, after this june11.dll got into the system we can see there is multiple POST from 10.6.12.203 system to snnmnkxdhflwgthqismb.com. The user did not do this POST, but the downloaded malware started doing this. It’s very difficult to catch this type of issue on run time. One more point to be noticed that the POST are simple HTTP packets instead of HTTPS, but most of the time, ZLoader packets are HTTPS. In that case, it’s quite impossible to see it, unlike HTTP.
This is HTTP post-infection traffic for ZLoader malware.
Summary of malware analysis:
We can say 10.6.12.203 got infected because of downloading june11.dll but did not get any more information about 10.6.12.157 after this host downloaded invoice-86495.doc file.
This is an example of one type of malware, but there may be different types of malware which work in a different style. Each has a different pattern to damage systems.
Conclusion and next learning steps in Network Forensic Analysis:
In conclusion, we can say there many types of network attacks. It’s not an easy job to learn everything in detail for all attacks, but we can get the pattern for famous attacks discussed in this chapter.
In summary, here are the points we should know step by step to get the primary hints for any attack.
1. Know basic knowledge of the OSI/ TCP-IP layer and understand the role of each layer. There are multiple fields in each layer, and it carries some information. We should be aware of these.
2. Know the basics of Wireshark and get comfortable using it. Because there are some Wireshark options that help us to get the expected information easily.
3. Get an idea for attacks discussed here and try to match the pattern with your real Wireshark capture data.
Here are some tips for the next learning steps in Network Forensic Analysis:
1. Try to learn advanced features of Wireshark for a quick, large file, complex analysis. All documents about Wireshark are easily available in the Wireshark website. This gives you more strength to Wireshark.
2. Understand different scenarios for the same attack. Here is an article we have discussed port scan giving an example as TCP half, full connect scan, but there are many other types of port scans like ARP scan, Ping Sweep, Null scan, Xmas Scan, UDP scan, IP protocol scan.
3. Do more analysis for sample capture available on the Wireshark website instead of waiting for real capture and start the analysis. You can follow this link to download sample captures and try to do basic analysis.
4. There are other Linux open-source tools like tcpdump, snort which can be used to do the capture analysis along with Wireshark. But the different tool has a different style of doing analysis; we need to learn that first.
5. Try to use some open-source tool and simulate some network attack, then capture and do the analysis. This gives confidence, and also, we will be familiar with the attack environment.