The Apache access.log is the most crucial one when using the Apache Web server because it contains a collection of events on the Apache webserver, providing detailed server utilization and errors.
This tutorial will look at various ways to comb through the apache log file to find and locate relevant information.
Access Log Location
The location of the access.log can vary depending on the operating system and the value of the CustomLog directive.
By default, you will find the access log stored in /var/log/apache2/access.log (Debian and Ubuntu). On Fedora, CentOS and REHL, you’ll find the file stored in /var/log/httpd/access_log
Finding Information Using HTTP codes
The simplest way to gather information from the Apache access log is to use tools like cat, less, and grep.
For example, to gather information on a specific HTTP code, we can enter the command:
The command above will search the access.log file for HTTP code 200. Below is an example output:
"-" "Mozilla/5.0 (Windows NT 10.0; Win64; x64) AppleWebKit/537.36
(KHTML, like Gecko) Chrome/93.0.4577.63 Safari/537.36"
172.25.64.1 - - [10/Sep/2021:12:18:47 +0300] "GET /icons/openlogo-
75.png HTTP/1.1" 200 6040 "http://172.25.66.206/" "Mozilla/5.0
(Windows NT 10.0; Win64; x64) AppleWebKit/537.36 (KHTML, like Gecko)
Chrome/93.0.4577.63 Safari/537.36"
We can also tie two commands and grab for more specific information. For example, we can grab the IP addresses that return the 200 OK status code as:
An example output is below:
How to Analyze Logs Using GoAccess
Although manually finding information in Apache access.log file is adequate for small tasks, it quickly becomes cumbersome for a server with thousands of requests. It also does not offer a real-time information view for the logs.
In such a case, we can use a simple tool such as goaccess to analyze logs in real-time.
To install the package, enter the command:
Once installed, launch the utility and point it to the access.log. Here’s an example command:
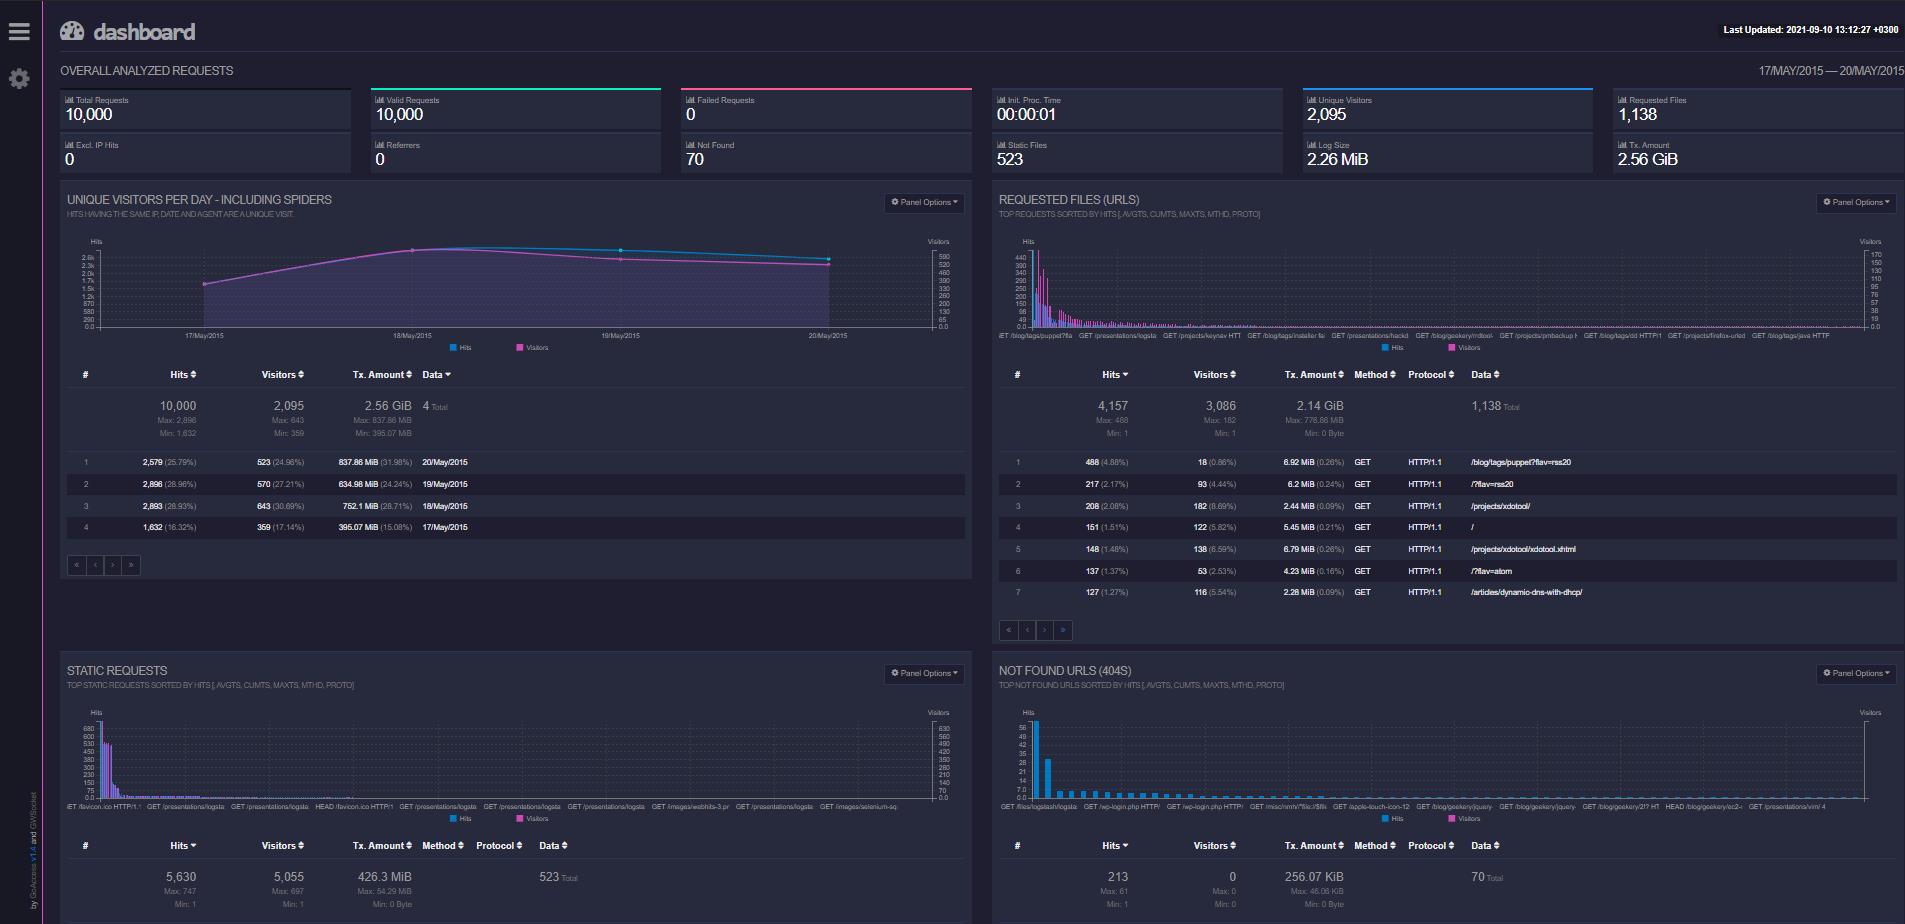
GoAccess will parse the access.log file and dump detailed and well-organized data about the web server logs.
You can open the file by navigating to http://SERVER_ADDRESS/report.html where the server address is the address under which Apache is running. You should see a sample dashboard such as the one shown below:
Using the GoAccess web interface, you can filter for specific information such as 404 URL, operating system information, browser information, and more.
GoAccess also allows you to export the logs as JSON to parse to tools such as Grafana and Logstash.
TIP: If you are on a Windows system, you can use a tool like the Apache HTTP Log Viewer to analyze and filter specific log entries.
Conclusion
In this guide, we discussed two simple steps to analyze Apache logs. If you are looking for a more visual and detailed method, check out our visualizing Apache Logs with ELK stack.
Thank you for reading!

