Elasticsearch is a well-established, distributed, and open-source analytical database and search engine. It is mostly used to store bulky, unstructured, and raw data. With time passing, Elasticsearch is growing and introducing new features to make Elasticsearch stand out among other search engines. In this era, the Elastic stack is one of the best evolutions of the Elasticsearch community.
Elastic stack is a combination of different tools that are Elasticsearch, logstash, Kibana, and the Beat family. The beat family is a combination of different lightweight beat components and Filebeat is one of them that is used to ship log data from different sources to Elastic stash.
This blog will demonstrate:
Prerequisites: Install Elasticsearch and Kibana
To get started with Elastic stack Beat, users are required to install Elasticsearch and Kibana on the system. To do so, go through the below-provided links:
- Install Elasticsearch: Elasticsearch is a simple and flexible search engine that is used to store and analyze unstructured or semi-structured data by using Query DSL. To set up and install Elasticsearch on the system, follow our associated post.
- Install Kibana: Kibana is a visualization tool that is utilized to view Elasticsearch data in a more convenient way using Pie charts, line graphs, heap maps, and so on. To install and set up Kibana with Elasticsearch on Windows, go through our linked article.
How to Setup Filebeat on Windows for Elasticsearch?
Filebeat is one of the components or members of the Beat family that is specifically used to ship log data from different sources to Elasticsearch stash. To set up Filebeat on Windows for Elasticsearch, follow up on the listed instructions.
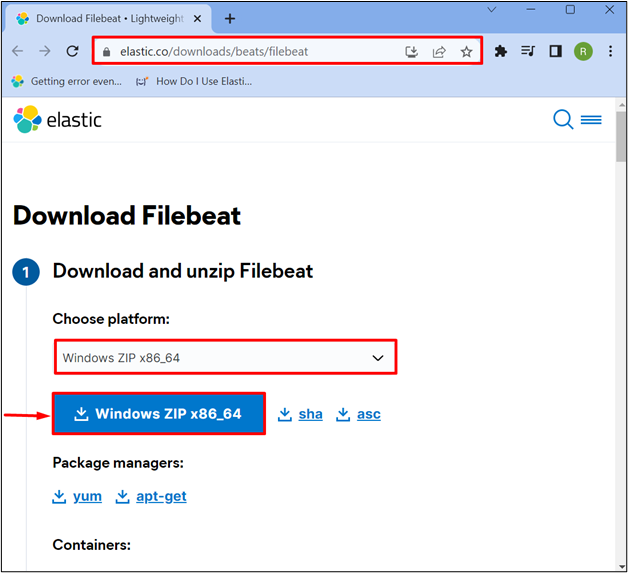
Step 1: Download Filebeat Zip Setup
First, download the Filebeat zip setup for Windows from Elasticsearch’s official website:
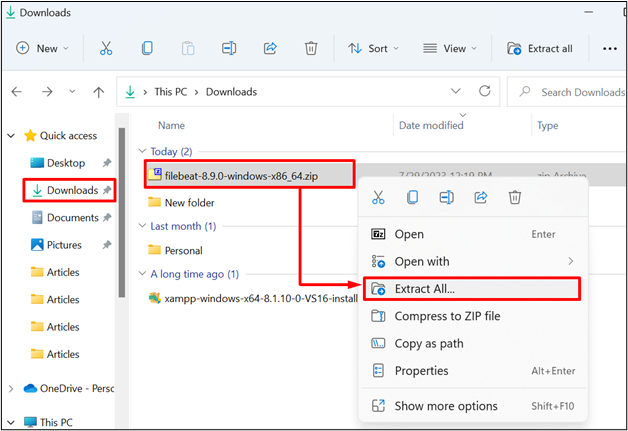
Step 2: Extract the Setup
After that, navigate to the directory where the Filebeat setup is downloaded (usually in the “Downloads” directory). Right-click on the Filebeat zip file and hit the “Extract All” option to extract the setup:
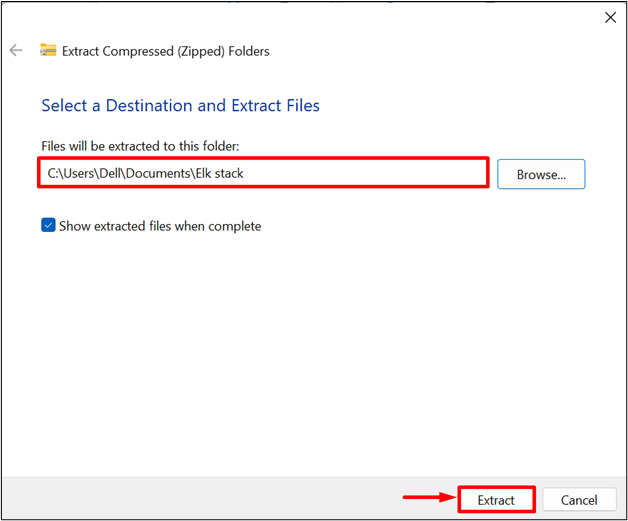
Next, browse the location where you are required to set up the Filebeat. For instance, we have chosen the “ELK stack” directory where Elasticsearch and Kibana are already installed. After that, press the “Extract” button:
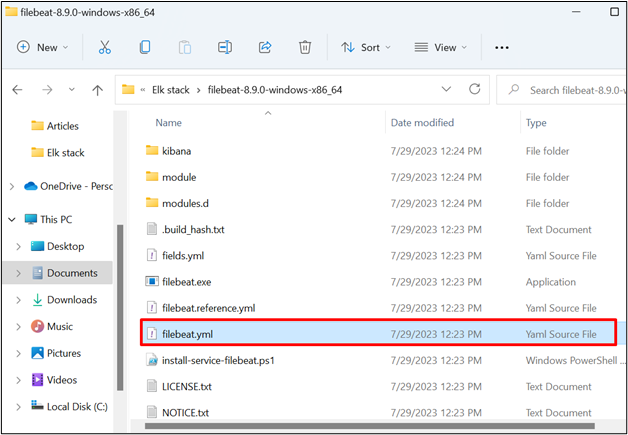
Step 3: Modify filebeat.yml File
Next, open the extracted folder and search for the “filebeat.yml” file. Once found, open it in any text editor:
Make some changes in the “filebeat.yml” file that are listed below:
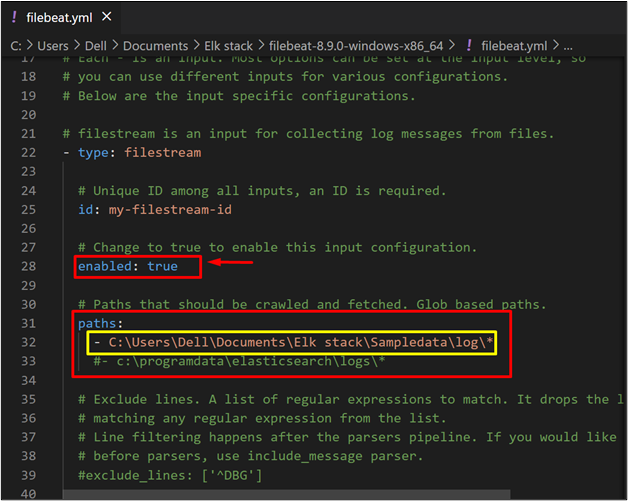
Add Path to Access Log: First, add the path of the directory from where you want to access log data. For instance, we have created a “log” directory in the “Sampledata” folder and set the path of that directory at the below-pointed place in the “filebeat.yml” file. Also, set the below-highlighted value as “true” to enable input configuration:
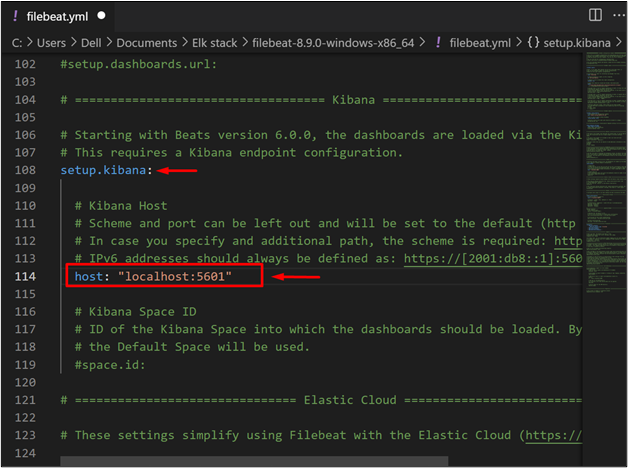
Enable Kibana: Scroll down and find the “kibana” line and uncomment the below-pointed line to access Kibana at its default address:
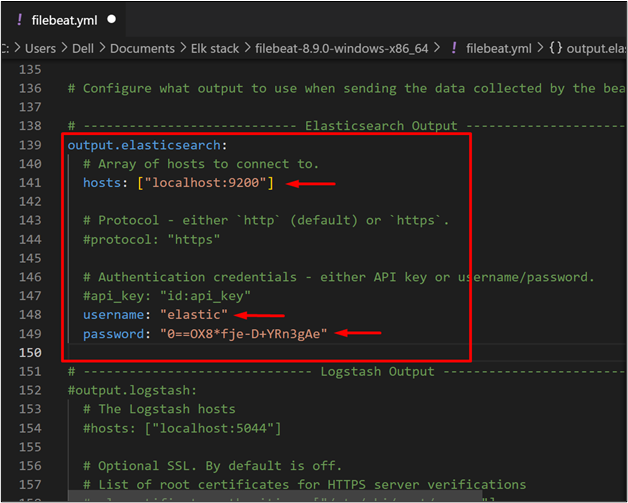
Configure Elasticsearch: Now, move down and find the “Elasticsearch Output” part. Here, configure the Elasticsearch default URL to access Elasticsearch. Also, set the Elasticsearch account credentials such as “Username” and “Password”:
After that, save the configuration by pressing the “CTRL+S” key and close the file.
Step 4: Start Elasticsearch
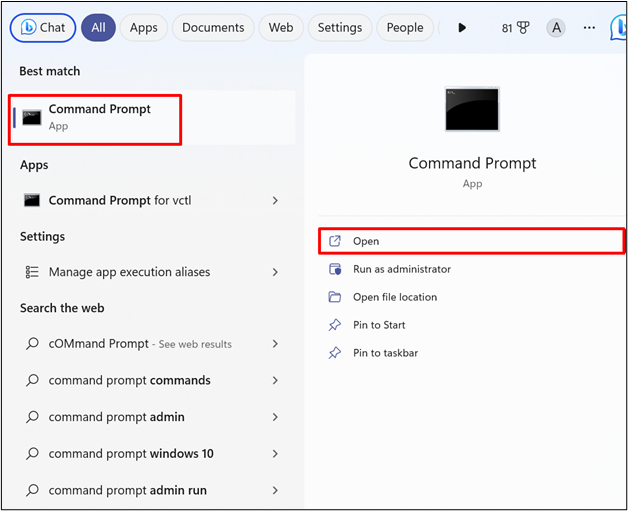
In the next step, start the Elasticsearch database on the system. To do so, first, open up the Windows Control Panel terminal via the “Startup” menu:
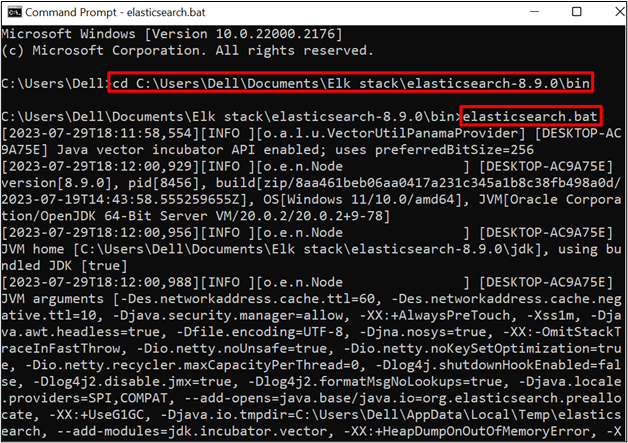
Next, navigate to the Elasticsearch “bin” folder as done below:
Now, execute the Elasticsearch batch file to start the engine on the system:
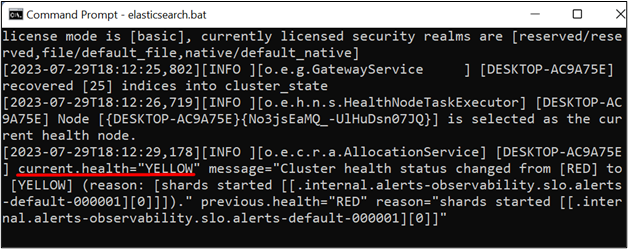
When the Elasticsearch cluster health turns to “YELLOW”, it means Elasticsearch is now running on the system:
Step 5: Start Kibana
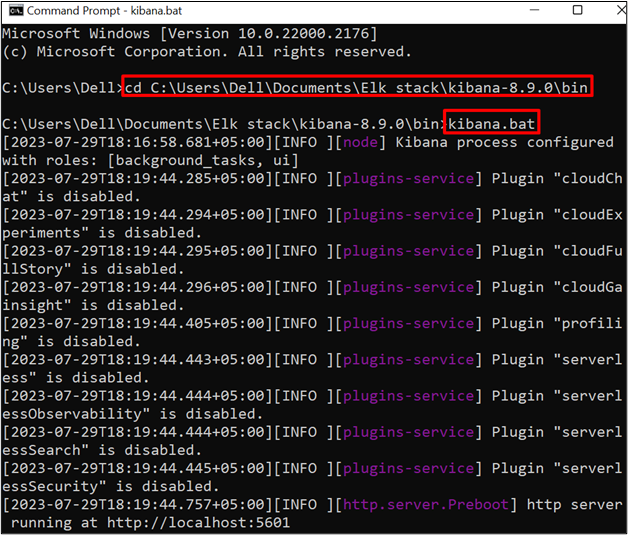
Start the Kibana on the system. To do so, first, launch its “bin” directory through the “cd” command:
Next, run the batch file of Kibana “kibana.bat” to start it on the system:
Step 6: Start Filebeat
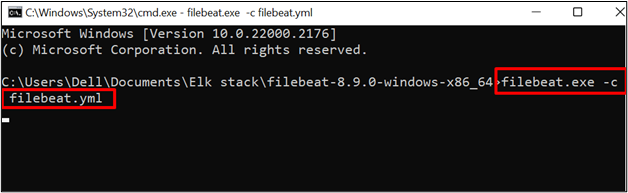
Next, open the Filebeat extracted directory where the “filebeat.exe” file exists using the “cd” command. After that, run the below command to read the “filebeat.yml” file. This file will load the log data from the path that was specified in Step 3 to Kibana:
Step 7: Sign In to Kibana
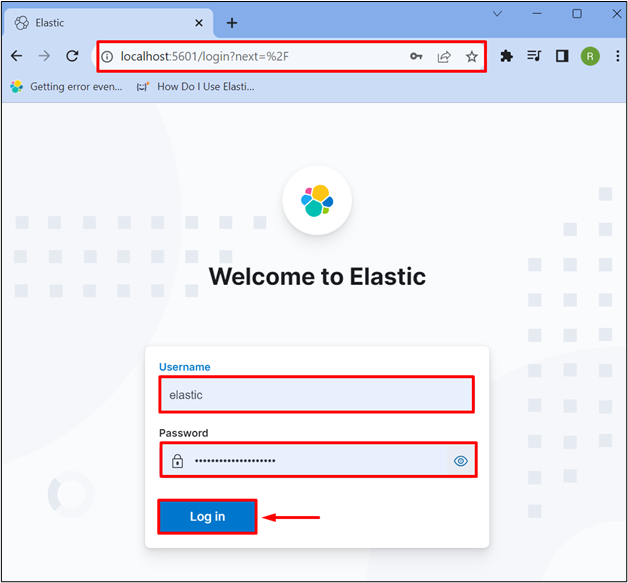
Now, navigate to the “localhost:5601” in the browser and add the username and password of Elasticsearch and press the “Log in” button to sign in to Kibana:
Step 8: Navigate to Management
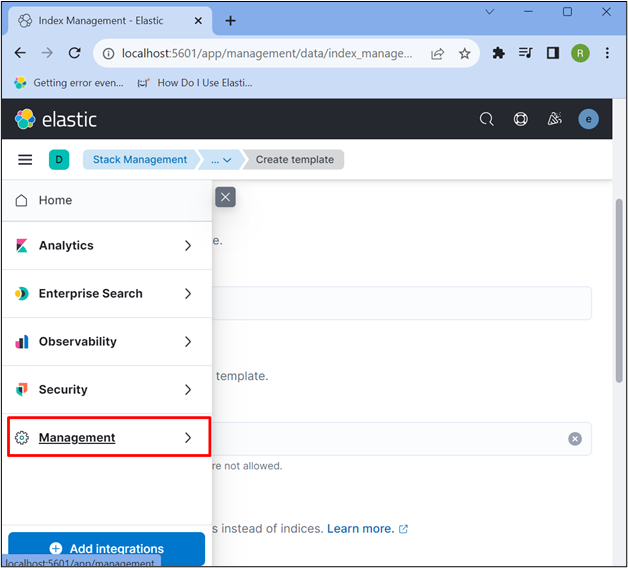
When the Kibana UI appears on the screen, open its menu by clicking on the “Three horizontal bar” icon and choose the “Management” option:
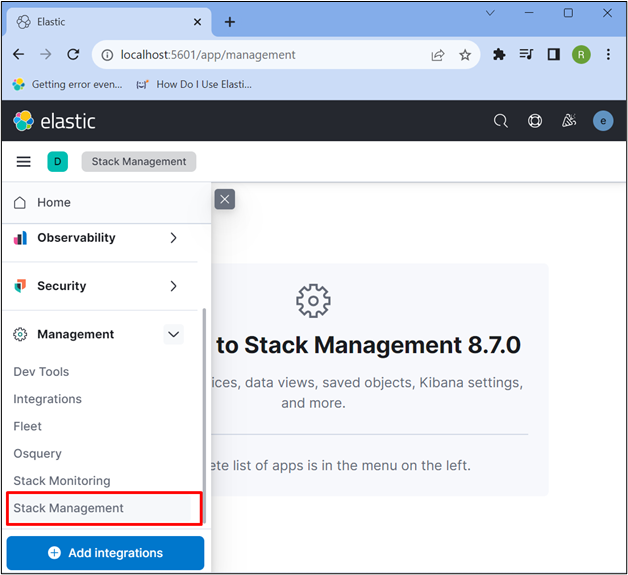
After that, visit the “Stack Management” option to configure Filebeat with Kibana and Elasticsearch:
Step 9: Create Data Views for Filebeat
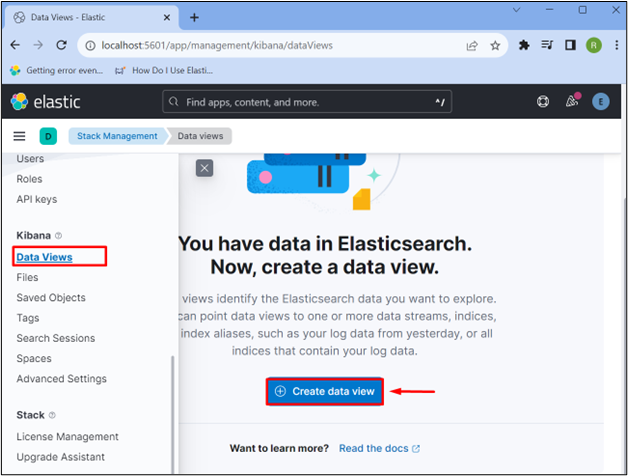
Now, define a new “Index Pattern” by clicking on the “Data Views” option. Don’t be confused by the “Index Pattern” and “Data Views” options. In the latest version, the “Index Pattern” option is replaced by the “Data Views” option. Now, create a new Data view by hitting the below highlighted “Create data view” button:
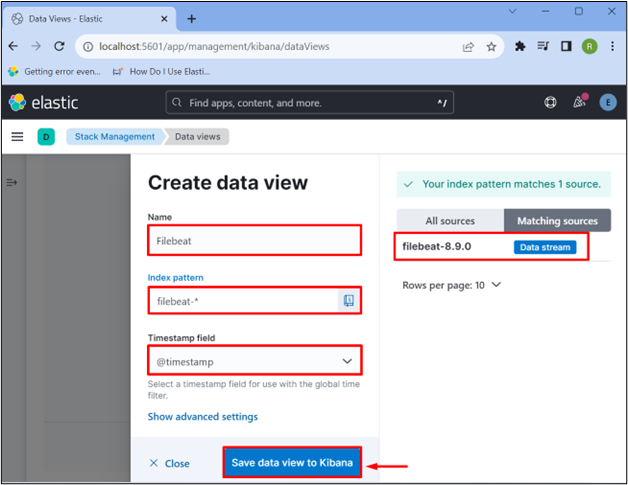
Here, you can see one source is matching. This data stream is loaded after the execution of Step 6.
Now, set the name for the Data view, specify the “Index pattern” as “filebeat-*” to read the available matching sources and the “Timestamp field” as “@timestamp”. Now, hit the “Save data view in Kibana” button to save changes:
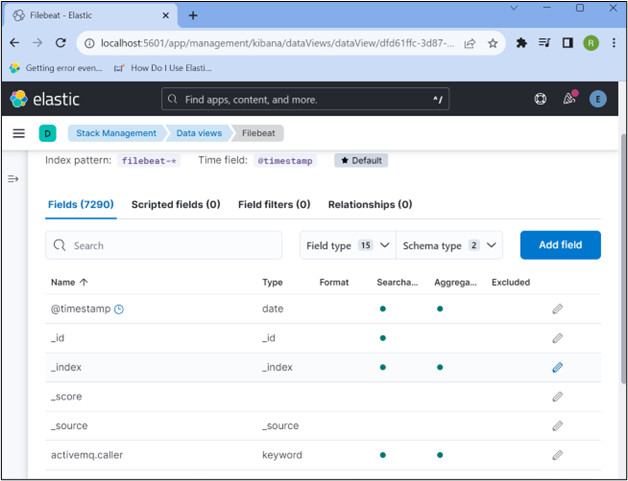
Here, you can see we have successfully set the Index pattern “filebeat-*” for Filebeat in Kibana:
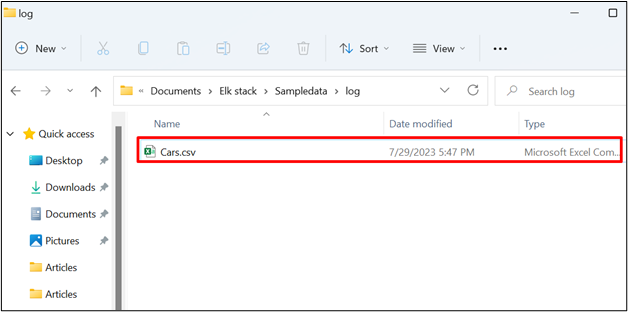
Now, add the dummy data in the “log” directory from where Filebeat will ship the log data to Kibana and Elasticsearch. For instance, we have added a “Cars.csv” file in the “C:\Users\Dell\Documents\Elk stack\Sampledata\log” directory:
Step 10: Navigate to Discover For Verification
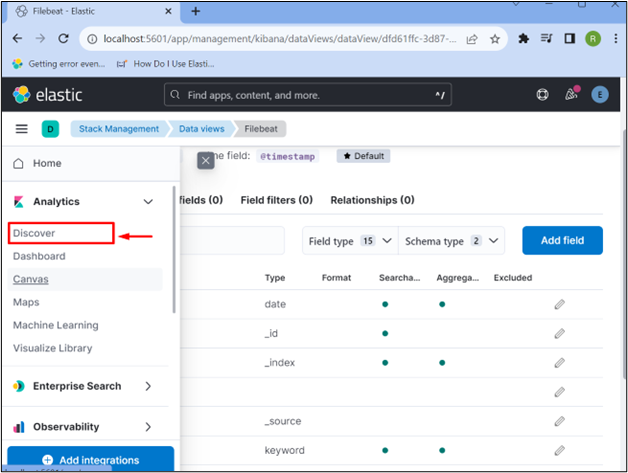
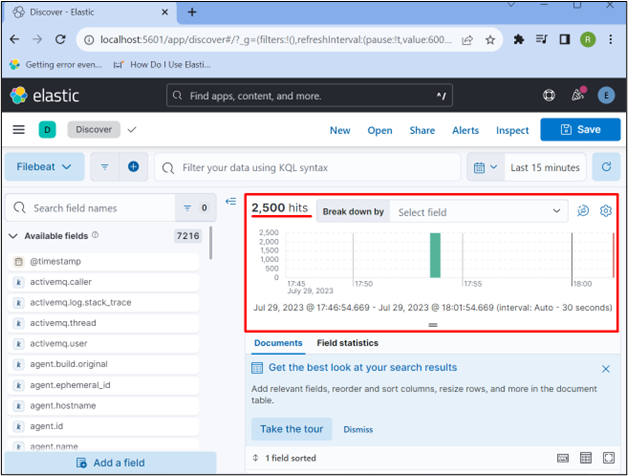
For verification, navigate to the “Discover” menu and check if Filebeat has loaded the data from the specified directory or not:
The below output indicates that Kibana is accessing data from the specified “C:\Users\Dell\Documents\Elk stack\Sampledata\log” path and showing the data in graphical form:
That is all about setting up Filebeat on Windows in Elasticsearch.
Conclusion
To set up Filebeat on Windows, first, download its zip setup from the official website and extract it. After that, modify the “filebeat.yml” file and add the path from where you are required to read logs, also configure the Kibana and Elasticsearch search to access them. Now, start Elasticsearch and Kibana on the system. After that, run the “filebeat.exe -c filebeat.yml” command. Create the new Data View for Filebeat in Kibana to access or load the log data source from Kibana. This post has elaborated on how to set up Filebeat on Windows.