A Dispersion Plot, also known as a Distplot, displays the variance in the original dataset. The total dispersion of a real-time data parameters is shown by the distplot() function of the Seaborn framework. The Seaborn library, in conjunction with the Matplotlib library, is applied to visualize the distplot among the several modifications. The data is represented by using a histogram as well as a curve in the Distplot.
The Seaborn library incorporates a range of methods for plotting the information and displaying the data fluctuations. The Distplot is created using the Seaborn package’s distplot() method. The Distplot illustrates the unitary model parameters, that is the statistical dispersion of a parameter versus the dispersion relation.
The dataset parameter is passed to the distplot() method, which returns a graph having the dispersion relation. To determine the possibility of dispersal of the dependent variables over the multiple data sets, the distplot() method of the Seaborn library can be combined with the KDE plot. The term KDE is abbreviated as Kernel Density Estimate. Let’s discuss the Seaborn Distplot in detail:
Example 1:
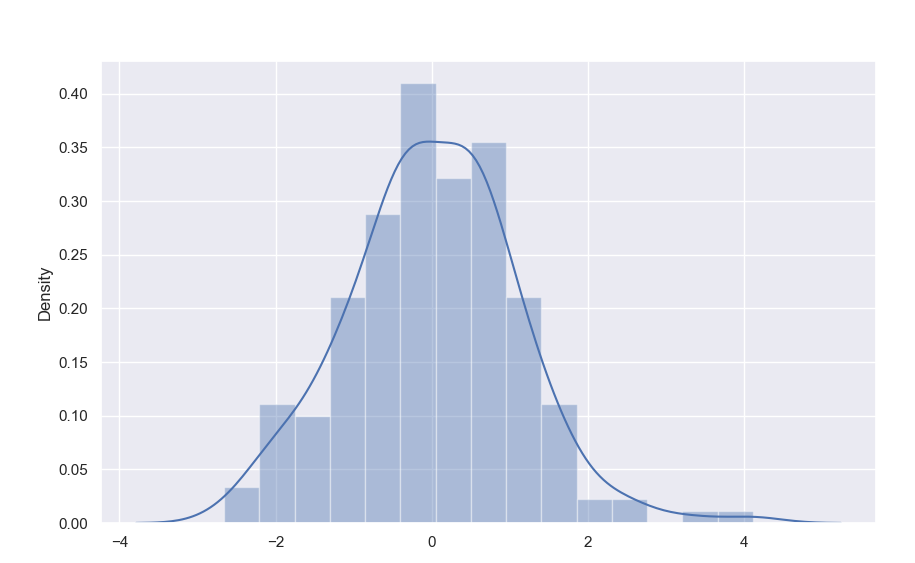
The following graphic illustrates a simple dispersion in this step. With the help of random.randn(), it randomly generates values. It operates when we specify the attributes manually.
1 2 3 4 5 6 7 | import matplotlib.pyplot as plt import seaborn as sns, numpy as np sns.set(rc={"figure.figsize": (10, 6)}); np.random.seed(2) x = np.random.randn(200) ax = sns.distplot(x) plt.show() |
First of all, we introduced the three header files. The matplotlib.pyplot header file is imported as plt. Seaborn is introduced as sns. And NumPy is introduced as np. Then we utilized the two functions from the different libraries. The set() function is applied to specify the size of the plot. So, we provided the parameter of the “figsize”. This function is related to the Seaborn library.
We employed the randn()function of the header file NumPy library. The value is stored in the “x’” variable. The distplot() method is applied to draw the graph. This function contains the value of the x variable as its argument. Lastly, the plt.show() method is used to represent the plot.
Example 2:
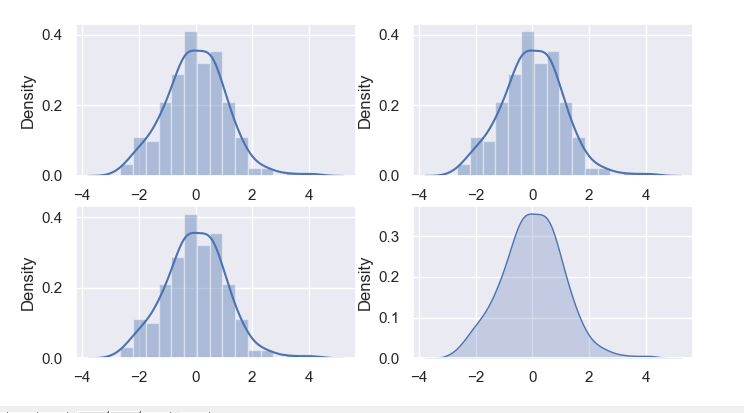
The Distplot is displayed in a variety of ways. To illustrate the four variants simultaneously, we utilize the subplot() function of the pylab framework method. We may generate a completely distinct visualizations by modifying the arguments of the distplot() function. Users will interact with some of these arguments to alter the tint, layout, and other aspects.
At the start of the program, we have to import some important libraries. Every pyplot method modifies a visual in a certain aspect. Seaborn is a matplotlib-based visual analytical package. NumPy is a Python module for a widely used numerical computation. Pylab is a library that integrates methods from within the NumPy and Matplotlib packages to create an integrated development environment.
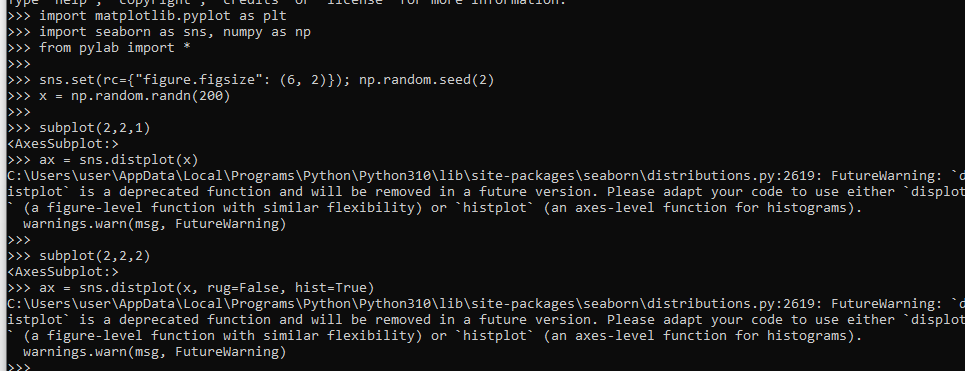
In the next step, we specify the size of the figure. So, we apply the set() method of the Seaborn library. Along with this, we utilize the seed() and randn() methods. Both of these functions are included in the NumPy library. In this case, we draw the four different Distplots. We invoke the distplot() methods separately into four subplots. To draw the first subplot, we simply set its dimensions and then apply the distplot() function of the Seaborn library. For the second subplot, we provide the parameters “rug” and “hist” to the distplot()function.
For drawing the third subplot, we employ the displot() method after defining the dimensions. Here, we set the “False” value to the “vertical” variable. Similarly, for the last one, we want to draw a KDE graph so we use the kdeplot() function of the Seaborn library. The value of the “shade” parameter is given as “true”. And the value of the “color” is set as “b”. At the end, to display these subplots, the plt.show() method is applied.
Example 3:
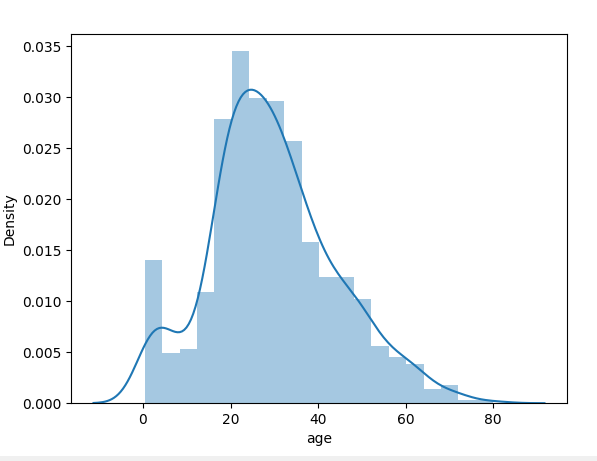
In the histogram, we sometimes exhibit the usual data frame of the Seaborn module. Because this is such an enormous dataset, just one entry will suffice.
1 2 3 4 5 6 | import matplotlib.pyplot as plt import seaborn as sns titanic=sns.load_dataset('titanic') age1=titanic['age'].dropna() sns.distplot(age1) plt.show() |
Here, we incorporate the “plt” and “sns” libraries. The “plt” library is imported by matplotlib.pyplot and the “sns” library is imported by the Seaborn library. Here, we retrieve the data frame of the Titanic so we called the load_dataset() method of the Seaborn library. In the next step of depicting the Displot, we used the distplot() method. Finally, the graph is illustrated by using the plt.show() function.
Example 4:
It is also possible to adjust the size of the bins as well as eliminate the line. In this instance, we will specify the size of the bins as well as make the border of KDE transparent by invoking the distplot()function.
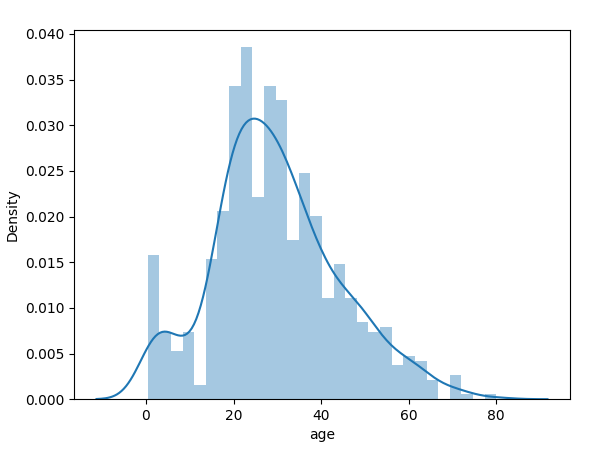
1 2 3 4 5 6 7 | import matplotlib.pyplot as plt import seaborn as sns titanic=sns.load_dataset('titanic') age1=titanic['age'].dropna() sns.distplot(age1,bins=30,kde=True) plt.show() |
After importing the required header files, matplotlib.pyplot and seaborn, we intend to get the Titanic data set. Thus, we used the Seaborn library’s load dataset() method. We called the distplot() function to draw the graph. There are three parameters in this method. The distplot() function allows us to define the bin size and the value of “KDE”. The value of “KDE” is set to “True” in this case. Then, by using the plt.show() method, the graph is seen.
Conclusion
We demonstrated how to draw Distplots by using the Seaborn library in this article. We’ve seen a variety of examples related to this given topic. The distplot() function of the Seaborn library allows the users to display a histogram having a line. This could be illustrated in several diverse ways. Seaborn is often applied in association with Matplotlib, which is a visualization framework. A Distplot is a graph that shows a single-variate dispersion of the data. The hist method of Matplotlib is integrated by the kdeplot() method in the distplot() method.


