Python programming language is a high-level programming language that offers a wide range of helpful functions for all kinds of mathematical, statistical, and scientific computations. We can perform any simple as well as complex function using the functions and methods of Python libraries. This guide deals with the SciPy find_peaks() function for signal processing analysis. More specifically, this guide focuses on how to calculate and identify the peaks incorporated in a signal.
What Is SciPy Find Peaks?
The SciPy library offers a find_peaks() function to be used to find the maxima, minima, or peak of a signal. The find_peaks() function is used with the signals to analyze them. It is used to find the signal’s peak, minima, or maxima of a mathematical function. It finds the peaks inside the given signals based on peak properties. By comparing the values of the nearby values, this SciPy function analyses the data in the form of a one-dimensional array to identify all local maxima. Let us understand the syntax of the find_peaks() function and then move on to the example section to learn how the find_peaks() function works in a Python program.
Syntax of SciPy Find Peaks Function
We are about to exploit the find_peaks() function provided by the SciPy library and its signal package. As we previously discussed, the find_peaks() function is used to process a specific signal to extract the intensity or the position of multiple signal peaks. See the syntax of the following function:

The “peak” parameter is used to define the signal with peaks. The “height” parameter is used to define the height of peaks. The “threshold” parameter is an ndarray or just a number that defines the threshold of peaks. The “distance” parameter is used to define the minimum horizontal distance between neighboring peaks. The “prominence” parameter is used to define the prominence of peaks. The “width” parameter defines the width of peaks. The “wlen” parameter is used to calculate the prominences of the peak. The “rel_height” parameter is used to calculate the width of the peaks. Lastly, the “plateau_size” parameter is used to define the flat top of the peaks. The find_peaks() function returns an ndarray which contains all the peak indices that satisfy the given conditions along with their properties. Now, let us explore some helpful programming examples to learn how to implement the find_peaks function.
Example 1:
From economics to data sciences to electronics, working with the peaks of signals holds fundamental significance in all prominent fields. As previously discussed, peak finding is not just about finding the peak of an electronic signal but the minima or maxima of any mathematical function. Since we know the importance of having a reliable and quick function that helps us find the value and position of the minima and maxima, let us use the find_peaks() function for automatic and fast computation. Consider the sample program in the following code snippet:
import matplotlib.pyplot as plt
from scipy.signal import find_peaks
#******Data Declaration******
x = np.linspace(0, 100, 200)
y = x*np.random.randn(200)**2
#******Peak Finding******
peaks = find_peaks(y, height = 2, threshold = 2, distance = 2)
h = peaks[1]['peak_heights']
pp = x[peaks[0]]
#******Minima Finding******
y2 = y*-2
minima = find_peaks(y2)
min_pos = x[minima[0]]
min_height = y2[minima[0]]
#******Data Plotting******
plt.plot(x,y)
plt.scatter(pp, h, color = 'r', label = 'Maxima')
plt.scatter(min_pos, min_height*-1, label = 'Minima')
plt.legend()
plt.grid()
plt.show()
Three libraries are imported into the program – NumPy, SciPy, and Matplotlib. The NumPy library is used to declare the NumPy arrays. The SciPy library is used to call the find_peaks() function. And the Matplotlib library is used to plot the graph.
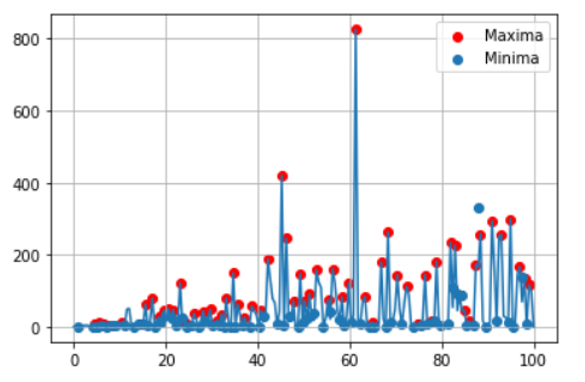
As you can see, we grouped the lines of code according to the function they are performing. First, we have the “Data Declaration” section where we define the data for the find_peaks() function. The second section is “Peak Finding” where we use the find_peaks() function by passing the recently declared data.
The third section of the program is “Minima Finding” where we compute the minima and maxima of the given data. The last section is “Data Plotting” where we plot the data using the plt.plot() and plt.show() functions. To see the graph generated by the given program, refer to the following generated output:
Example 2:
Working with signals is not just important for the data science or electronics field but it can also be used in the medical field. Electronic signal processing is most commonly used and has higher importance in the medical field than in any other field. In this example, we will exploit the electrocardiogram function to interpret an electronic signal. See the sample code in the following code snippet:
from scipy.signal import find_peaks
from scipy.misc import electrocardiogram
#******Peak Finding******
x = electrocardiogram()[1000:3000]
peaks, _ = find_peaks(x, height=1)
#******Data Plotting******
plt.plot(x)
plt.plot(peaks, x[peaks], "x")
plt.plot(np.zeros_like(x), "--", color="gray")
plt.show()
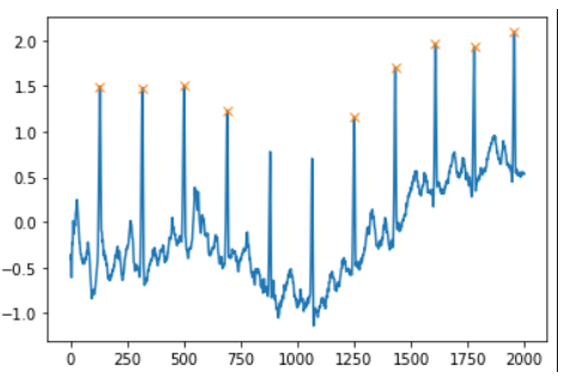
The matplotlib library is included in the program to plot the graph. The SciPy library is used to call the signal and misc package so that the find_peaks and electrocardiogram functions can be called from the respective package. Now, just like in the previous example, we segment the program into sections. The first section is the “Peak Finding” section where we use the find_peaks() and electrocardiogram() functions to find the peaks of the generated electrocardiogram. The last section is the “Data Plotting” section where we plot the graph. Now, let us see the plotted graph in the following output:
Example 3:
Let’s run through another example so you can clearly see how the findpeaks() function works. Consider the followign sample code:
from scipy import signal
import matplotlib.pyplot as plt
#******Data Declaration******
data = np.linspace(0, 4 * np.pi, 100)
sig = np.sin(data) + 0.4 * np.sin(1.8 * data)
#******Peak Finding******
sp, _ = signal.find_peaks(sig)
promin = signal.peak_prominences(sig, sp)[0]
h = sig[sp] - promin
#******Data Plotting******
plt.plot(sig)
plt.plot(sp, sig[sp], "*")
plt.vlines(x=sp, ymin=h, ymax=sig[sp])
plt.show()
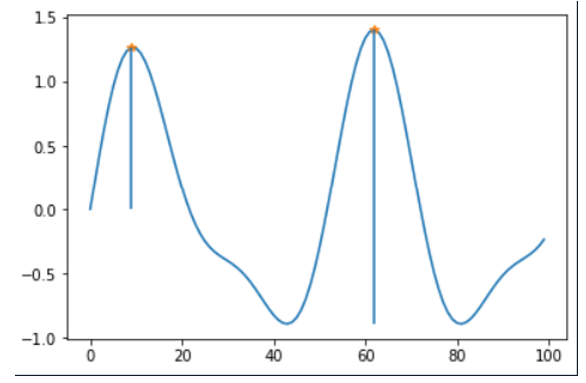
Again, the program is segmented into different sections, since each section performs a different function. The data is declared in the “Data Declaration” section. The peak finding function is performed in the “Peak Finding” section. Lastly, the graph is plotted in the “Data Plotting” section. Now, let us check the plotted graph in the following output:
Conclusion
This guide deals with the processing and analysis of the signals using the find_peaks() function. The find_peaks() is a signal processing function defined in the SciPy library of Python. It is used to find the peaks of the signal, maxima, and minima of any mathematical function. We explored some simple and complex examples to understand how the find_peaks() function can be implemented in a Python program. We specifically focused on calculating and finding the peaks which are contained in the given data and not on finding the maxima or minima of the given data.