Statistics Module
The statistics module provides simple functions for computing the statistics of a data set. They claim that they are not competing with NumPy, SciPy, or other software such as SPSS, SAS, and Matlab. And indeed, it is a very simple module. It doesn’t provide parametric or even non-parametric tests. Instead, it can be used to do some simple computations (though I think that even Excel can do the same). They further claim that they support int, float, decimals, and fractions.
The statistics module can measure (1) averages and measures of central location, (2) measures of spread, and (3) statistics for relations between two inputs.
Statistics.mean()
The statistics module contains a large number of functions. We will not be covering each one, but rather a few of them. In this case, the data set is placed in a list. The list is then passed to the function.
For integers:
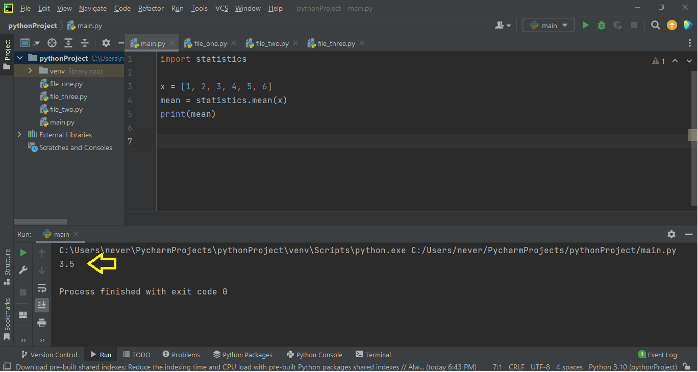
x = [1, 2, 3, 4, 5, 6]
mean = statistics.mean(x)
print(mean)
When you run the latter, you get:
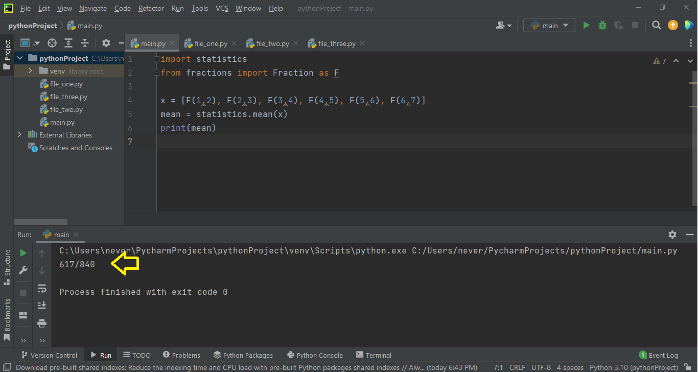
For fractions, the terminology is slightly different. You’ll have to import the module called fractions. Also, you need to place the fraction in brackets and write a capital F in front of it. Thus 0.5 would be equal to F(1,2). This is not feasible for large data sets!
from fractions, import Fraction as F
x = [F(1,2), F(2,3), F(3,4), F(4,5), F(5,6), F(6,7)]
mean = statistics.mean(x)
print(mean)
When you run the latter, you get:
In most research work, the most common type of number that is encountered is the decimal value, and that’s a lot harder to accomplish with the statistics module. You first have to import the decimal module and then put every decimal value in quotation (which is absurd and impractical if you have large data sets).
from decimal import Decimal as D
x = [D("0.5"), D("0.75"), D("1.75"), D("2.67"), D("7.77"), D("3.44")]
mean = statistics.mean(x)
print(mean)
When you run the latter, you get:

The statistics module also offers the fmean, geometric mean, and harmonic mean. Statistics.median() and statistics.mode() are similar to statistics.mean().
Statistics.variance() and statistics.stdev()
In research, very, very rarely is your sample size so large that it equals or approximately equals the population size. So, we’ll look at sample variance and sample standard deviation. However, they also offer a population variance and a population standard deviation.
Once again, if you want to use decimals, you have to import the decimals module, and if you want to use fractions, then you have to import the fractions module. This, in terms of statistical analysis, is rather absurd and very impractical.
from decimal import Decimal as D
x = [D("0.5"), D("0.75"), D("1.75"), D("2.67"), D("7.77"), D("3.44")]
var = statistics.variance(x)
print(var)
When you run the latter, you get:
Alternatively, the standard deviation can be computed by doing:
from decimal import Decimal as D
x = [D("0.5"), D("0.75"), D("1.75"), D("2.67"), D("7.77"), D("3.44")]
std = statistics.stdev(x)
print(std)
When you run the latter, you get:
Pearson Correlation
For some reason, although the authors of the statistics module ignored ANOVA tests, t-tests, etc… they did include correlation and simple linear regression. Mind you, pearson correlation is a specific type of correlation used only if the data is normal; it is thus a parametric test. There’s another test called spearman correlation which can also be used if the data is not normal (which tends to be the case).
x = [1.11, 2.45, 3.43, 4.56, 5.78, 6.99]
y = [1.45, 2.56, 3.78, 4.52, 5.97, 6.65]
corr = statistics.correlation(x, y)
print(corr)
When you run the latter, you get:
Linear Regression
When a simple linear regression is carried out, it chucks out a formula:
Excel does this as well. But the most this module can do is to print out the value of the slope and the intercept from which you can re-create the line. Excel and SPSS offer graphs to go with the equation, but none of that with the statistics module.
x = [1.11, 2.45, 3.43, 4.56, 5.78, 6.99]
y = [1.45, 2.56, 3.78, 4.52, 5.97, 6.65]
slope, intercept = statistics.linear_regression(x, y)
print("The slope is %s" % slope)
print("The intercept is %s" % intercept)
print("%s x + %s = y" % (slope, intercept))
When you run the latter, you get:
The intercept is 0.46169013364824574
0.9111784209749394 x + 0.46169013364824574 = y
Covariance
Additionally, the statistics module can measure covariance.
x = [1.11, 2.45, 3.43, 4.56, 5.78, 6.99]
y = [1.45, 2.56, 3.78, 4.52, 5.97, 6.65]
cov = statistics.covariance(x,y)
print(cov)
When you run the latter, you get:
Although Python offers a module called the statistics module, it is not for advanced statistics! Mind you, if you want to actually analyze your data set, then go with any module other than the statistics module! Not only is it too simple, but also all the features that it offers can easily be found in excel as well. Further, there are only two tests – the Pearson correlation and simple linear regression – that this module offers in terms of tests. There’s no ANOVA, no t-test, no chi-square, or any of the like! And what’s more, if you need to use decimals, you need to invoke the decimal module, which can be frustrating for large and very large data sets. You won’t catch anyone who needs real statistical work done using this module (go with SPSS if you need advanced stuff), but if it’s simple fun you’re looking for, then this module is for you.
Happy Coding!