Cleaning the Data with Python and Pandas
Data is like the building blocks of decision-making today. But imagine having a group of blocks of different shapes and sizes from this collection; it is tough to build anything meaningful. This is where the data cleaning comes in to help.
This guide explores how to clean the data using Python’s framework which is Pandas for better decision-making. Data cleaning is also essential, considering that we are working with a list of sales records for a store. We might notice some missing numbers, weird dates, and repeated items for no reason in the list. If we make the calculations or records based on this information, these issues can mess up our calculations and predictions. Data cleaning helps fix these problems, ensuring that our data is accurate and ready to use.
Data cleaning includes handling the missing data and what to do when some data is missing, removing the duplicates, getting rid of copied stuff, fixing the data types, making sure that everything is in the proper format, and dealing with outliers or handling the numbers that don’t fit in. These mistakes make the data look the same and standardize how the data appears.
To get started, make sure first that we have Python and Pandas installed. We can do this by typing the commands in our computer’s terminal or command prompt. To implement the codes that are mentioned in this guide, we may use the Python Pycharm IDE that is installed on our system or the online Python platform which is “Google Colab” and install the “pip” commands to install the important libraries.
Now, let’s import Pandas and load our sample data. For this example, we use Google Colab to run the codes. So, we first import Pandas by entering the following command:
import pandas as pd
import numpy as np
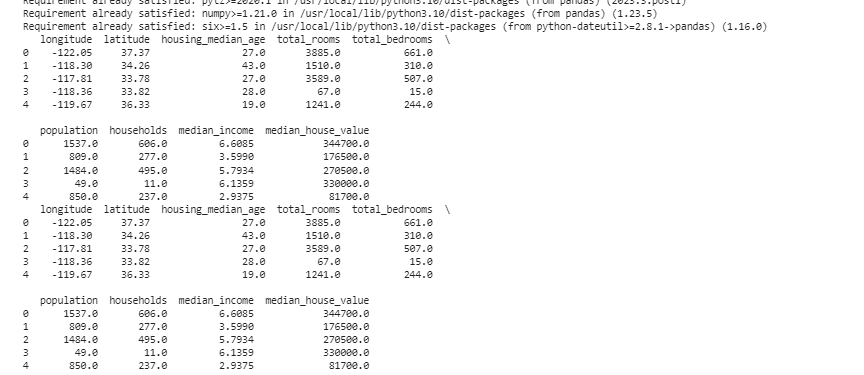
Then, we load the dataset that we want to display using the pd.read() method which takes the file path as its input parameter.
data = pd.read_csv('/content/sample_data/california_housing_test.csv')
# Display the first few rows
print(data.head())

In the next example, we use the data about sales in a small store. To handle the missing data, the information is sometimes missing in our data. We call these missing parts as “NaN” (which means “not a number”). To find these missing values in the Python script, we first load the data set as we did in the previous example. Then, we find any missing values in the data set using the “missing_values = data.isnull().sum()” function. This function finds all the missing values in the dataset. Then, we display them using the print () function.
import pandas as pd
import numpy as np
# Load the dataset
data = pd.read_csv('/content/sample_data/california_housing_test.csv')
# Display the first few rows
print(data.head())
# Check for missing values
missing_values = data.isnull().sum()
# Display missing values count by column
print(missing_values)

After we find any missing data in any row that runs the code that is previously mentioned, we can remove those rows since those rows don’t have much useful data. We can even guess those missing values and fill in the blanks with educated guesses by estimating the time-based data based on nearby points.
Now, we remove the duplicates that are copies of the same thing because they can confuse our analysis. To find the duplicate values in the data set, we use the “duplicate_rows = data[data.duplicated()]” function. To drop these duplicate values, we call the data.drop_duplicates() function. We can find and remove them using the following code:
import pandas as pd
import numpy as np
# Load the dataset
data = pd.read_csv('/content/sample_data/california_housing_test.csv')
# Display the first few rows
print(data.head())
# Check for duplicate rows
duplicate_rows = data[data.duplicated()]
# Remove duplicates
data = data.drop_duplicates()
# Display the first few rows after removing duplicates
print(data.head())
Data types decide what data can be stored to fix the data types. It’s essential to have the right type for each kind of data. For example, dates should have the data type of date time, and numbers should be in data type like int, float, etc. To check the data types of our data, we use the “data.dtypes” function. This function can be utilized in the following way:
import pandas as pd
import numpy as np
# Load the dataset
data = pd.read_csv('/content/sample_data/california_housing_test.csv')
# Display the first few rows
print(data.head())
# Check the data types of each column
data_types = data.dtypes
# Display data types
print(data_types)

If we find any issues, we can change the data type using Pandas. For instance, we can make dates into a date format. The “dtypes” attribute of a DataFrame provides information about the data types of each column. If we find that the data type mismatches, we can use Pandas’ astype() function to convert the columns to the desired types.
After the data types, we sometimes encounter outliers which are values that are very different from the others. They can mess up our calculations. To deal with outliers, we define a function that uses the “np.abs(stats.zscore(data))” z-score function which compares the values that exist in our data with the threshold value. Any value other than the range of this threshold is considered as an outlier. Let’s see how to find and handle the outliers:
import pandas as pd
import numpy as np
# Load the dataset
data = pd.read_csv('/content/sample_data/california_housing_test.csv')
# Display the first few rows
print(data.head())
from scipy import stats
def detect_outliers(data):
z_scores = np.abs(stats.zscore(data))
return np.where(z_scores > 3)
# Detect and handle outliers in the 'Sales' column
outliers = detect_outliers(data['longitude'])
data['longitude'].loc[outliers] = data['longitude'].median()
# Detect and handle outliers in the 'Units Sold' column
outliers = detect_outliers(data['latitude'])
data['latitude'].loc[outliers] = data['latitude'].median()
# Display the first few rows after handling outliers
print(data.head())

We use a simple method to find and fix the outliers in the previous code. It involves replacing the extreme values with the middle value of the data. This code uses the Z-score method to detect the outliers in our data set’s “longitude” and “latitude” columns. Outliers are replaced with the median values of their respective columns.
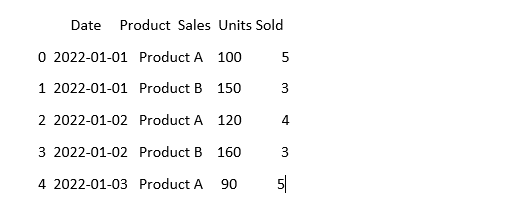
To make the data look the same, the data can sometimes look different even if it means the same thing. For instance, the dates can be written in various formats. Standardization involves ensuring a consistent data format and representation. This can include formatting the dates, converting the text to lowercase, or normalizing the numerical values. Let’s standardize the “Date” column in our dataset and make sure that our data looks the same:
import numpy as np # Import numpy
# Load the data
data = pd.read_csv('sales_data.csv')
# Make the 'Date' column look consistent
data['Date'] = pd.to_datetime(data['Date'])
# See what it looks like now
print(data.head())
In this example, we standardize the date format in our dataset to Python’s datetime format using the “pd.to_datetime(data[‘Date’])” function. By converting the “Date” column into the same format, we make it easier to work with this data. The output displays the first few rows of the dataset with the standardized “Date” column.
Conclusion
In our journey through data cleaning using Python and Pandas, we learned how to improve our data for analysis. We started by understanding why cleaning the data is so important. It helps us make better decisions. We explored how to deal with missing data, remove the duplicates, fix the data types, handle the outliers, and make our data look the same. With these skills, we are better prepared to turn a messy data into something that we can trust and use to discover an important information. Data cleaning is an ongoing process, like keeping our room tidy, and it makes our data analysis journey more successful.