In Python, the “Pandas” library is used for performing data analysis and manipulation on small and large groups of data. The Pandas library provides various methods to perform simple to complex tasks. One such task is to sum the values of a column or multiple columns in a DataFrame. This can be done utilizing the “DataFrame.sum()” method of Python.
This Python blog presents a detailed guide on how to sum columns in Pandas DataFrame via the below outline:
- What is the “sum()” Method in Python?
- Adding all the Columns of Pandas DataFrame
- Adding Specific Columns of Pandas DataFrame
- Adding Specific Columns Using “iloc[]” or “DataFrame.loc[]” Method Along With “DataFrame.sum()” Method
- Alternative Method: Adding all the Columns of Pandas DataFrame Using the “DataFrame.eval()” Function
What is the “DataFrame.sum()” Method in Python?
In Python, the “DataFrame.sum()” method is utilized to calculate/determine the sum of all values in each column.
Syntax
In the above syntax:
- The “axis” parameter is an optional parameter that specifies which axis to verify/check. It can be 0 (index) or 1 (columns). The default is None, which means both axes are summed.
- The “skipna” parameter determines/verifies whether to exclude/ignore NA/null values when computing the sum. The default is “True”, which means “NA” values are ignored.
- The “numeric_only” parameter indicates whether to include only numeric columns in the sum. The default is “False”, which means all columns are included.
- The “min_count” parameter sets the minimum number of valid values to perform the sum.
Return Value
The “DataFrame.sum()” method returns the sum/addition of the values over the requested or specified axis.
Example 1: Adding all the Columns of Pandas DataFrame
The following example add all the columns of Pandas DataFrame:
data1 = {"Name":["anna","henry","joseph"],"Marks1" :[1, 5, 3],"Marks2" :[7, 9, 5]}
df = pandas.DataFrame(data1, index=['A', 'B', 'C'])
print('Given DataFrame:\n', df)
print(df.sum(axis=1))
In the above code, the “pandas.DataFrame()” method is used to create the DataFrame with a specified index value. After that, the “df.sum()” method takes the “axis=1” as an argument to get the sum of all the columns.
Output
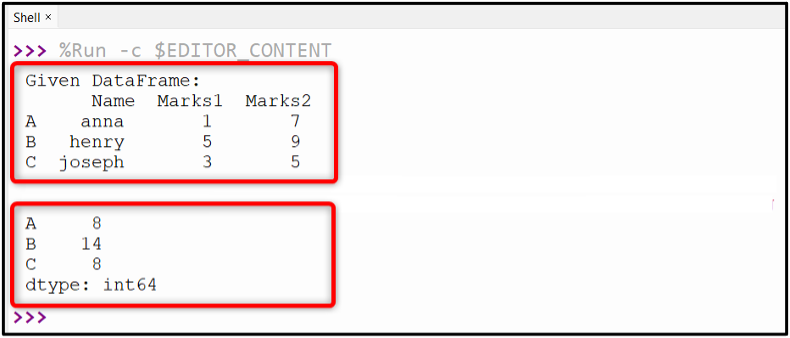
The column sum has been shown in the above output.
Example 2: Adding Specific Columns of Pandas DataFrame
This example is used to add the specific columns of Pandas DataFrame:
data1 = {"Name":["anna","henry","joseph"],"Marks1" :[1, 5, 3],"Marks2" :[7, 9, 5], "Marks3" :[4, 9, 8]}
df = pandas.DataFrame(data1, index=['A', 'B', 'C'])
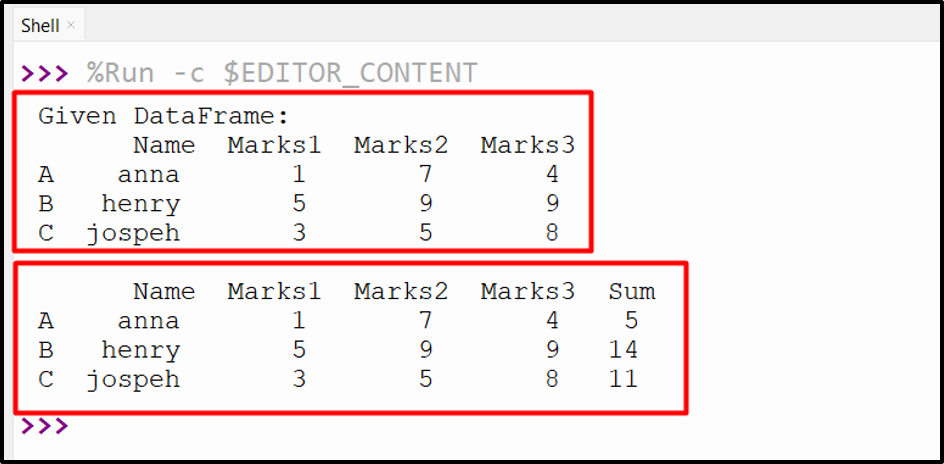
print('Given DataFrame:\n', df)
df['Sum'] = df[['Marks1', 'Marks3']].sum(axis=1)
print('\n',df)
In the above code, the “df.sum()” method takes the specified column’s name as an argument and retrieves the new column with the sum of the specified columns.
Output

The specified columns have been added successfully.
Example 3: Adding Specific Columns Using “DataFrame.iloc[]” or “DataFrame.loc[]” Method Along With “DataFrame.sum()” Method
The “DataFrame.iloc[]” method is used to access/invoke a group of columns and rows by integer/int position(s). It can be used to sum the values of a column based on its index position or a range of positions.
Let’s explore this method using the following code:
data1 = {"Name":["anna","henry","joseph"],"Marks1" :[1, 5, 3],"Marks2" :[7, 9, 5], "Marks3" :[4, 9, 8]}
df = pandas.DataFrame(data1, index=['A', 'B', 'C'])
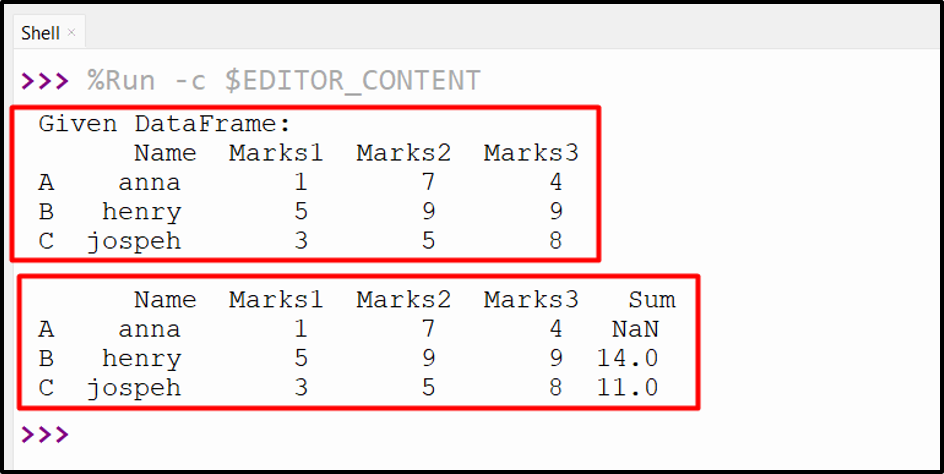
print('Given DataFrame:\n', df)
df['Sum']=df.iloc[:,[1,3]].sum(axis=1)
print('\n',df)
In the above example code, the “df.iloc()” is used with the “DataFrame.sum()” method to sum the specified columns of DataFrame.
Output
The above output shows that the columns named “Marks1” and “Marks3” have been added.
We can also use the “DataFrame.loc()” method to access/call a group of columns and rows by particular label(s) or a Boolean array. It can also be used to sum the values of a column based on a condition or a list of conditions.
Here is an example:
data1 = {"Name":["anna","henry","joseph"],"Marks1" :[1, 5, 3],"Marks2" :[7, 9, 5], "Marks3" :[4, 9, 8]}
df = pandas.DataFrame(data1, index=['A', 'B', 'C'])
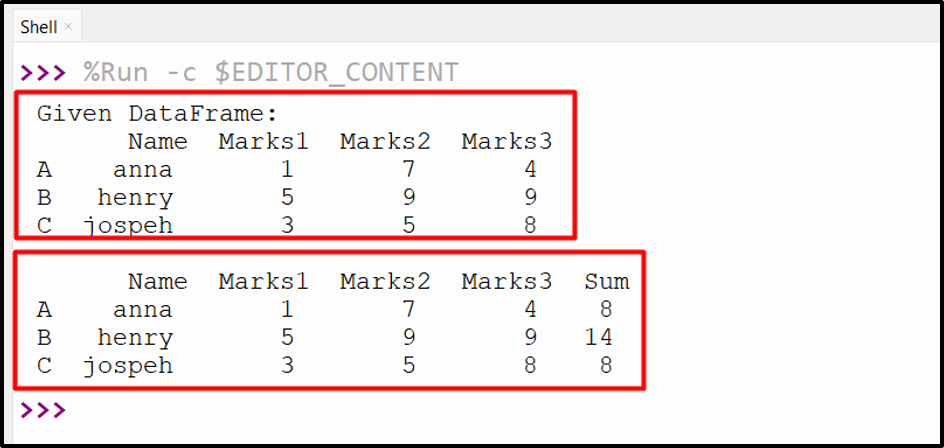
print('Given DataFrame:\n', df)
df['Sum'] = df.loc['B':'C',['Marks1','Marks3']].sum(axis = 1)
print('\n',df)
In the above code, the “df.loc()” method takes the column label as an argument and sums the specified columns using the “df.sum()” method. In this case, the sum operation is performed from index range “B” to “C” and on specific columns labels “Marks1” and “Marks3”.
Output
The specified columns of the DataFrame have been added successfully.
Alternative Method: Adding all the Columns of Pandas DataFrame Using the “DataFrame.eval()” Function
The “DataFrame.eval()” function takes the string as an argument and evaluates the DataFrame columns based on the operation described in the string. It is used to sum the values of multiple columns using arithmetic operators.
Example:
This example is used to add all the columns of Pandas DataFrame using the “eval()” function:
data1 = {"Name":["anna","henry","joseph"],"Marks1" :[1, 5, 3],"Marks2" :[7, 9, 5], "Marks3" :[4, 9, 8]}
df = pandas.DataFrame(data1, index=['A', 'B', 'C'])
print('Given DataFrame:\n', df)
df2 = df.eval('Sum = Marks1 + Marks2')
print('\n', df2)
In the above code, the “df.eval()” function takes the string expression “Sum = Marks1 + Marks2” as an argument and performs the operation on DataFrame.
Output
The particular DataFrame columns have been added successfully.
Conclusion
The “DataFrame.sum()” and “DataFrame.eval()” methods are used to add all the columns or specified columns of Pandas DataFrame in Python. The “DataFrame.sum()” method retrieves the sum of the specified columns by using the “df.loc()” and “df.iloc()” methods. The “DataFrame.eval()” method can also be used to sum specific columns based on the passed string operation. This blog provided an extensive tutorial on the Pandas sum column utilizing numerous examples.