But what is percentile? Percentile basically returns a number that tells the percentage of scores that fall below the given number. Consider a scenario: There are 100 students who appeared for an exam. Suppose a student got the 80th percentile which means that 80 percent (from total 100) of the students scored less than him and 20 percent of students scored more than him. In this guide, we will discuss how to calculate the percentile of the Pandas DataFrame column (single/multiple) using the pandas.DataFrame.quantile function. Also, we will see the parameters that are passed to this function separately with examples.
Pandas.DataFrame.Quantile
The pandas.DataFrame.quantile() returns the values at the given quantile. Using the axis parameter, we can compute the quantiles over the rows or columns. There are also different parameters that are passed to this function.
Syntax:
Let’s see the syntax and parameters that are passed to this function:
- The “q” (0 <= q <= 1) takes the percentile to calculate in the decimal form. By default, q = 0.5.
- The “axis” (by default = 0). We can calculate the percentile on the row axis (axis = 0) or column axis (axis = 1).
- We can also compute the percentiles on date types. If we set the numeric_only (default = False) to “True”, you can compute the percentile only on numeric type data like int64 and float64.
- The interpolation type can be specified by passing the interpolation parameter (by default – “linear”). We can specify any of the following interpolation to use when the quantile is between the values (“i” and “j”).
- linear: By default, the computation is i + (j – i) * fraction where fraction is the fractional part of the index surrounded by “i” and “j” (“i” refers to the first value and “j” refers to the second value).
- lower: “i” is returned
- higher: “j” is returned
- nearest: The value close to “i” or “j” is returned.
- midpoint: The return the value that is computed using (i+j)/2.
Analysis:
We will see the internal working of this function. Let’s have the values that are present in the DataFrame. The values are [94, 92, 90, 91, 93]. Calculate the 60th percentile.
- First, the function sorts the values in ascending order [90, 91, 92, 93, 94].
- Second, it takes the provided quantile value (q). We need the 60th percentile. So, q=0.6.
Formula: q * (size of the data + 1)
=> 0.6 * (5+1)
=> 0.6 * 6
=> 3.6
- The value lies in the third and fourth element.
- If the interpolation is “linear”, the computation is [ith value * fraction part of i + jth value * fraction part of j] (This works “q” with one decimal point). Here, “i” is 92 and “j” is 93.
=> (92 * 0.6) + (93 * 0.4)
=> 55.2 + 37.2
=> 92.4 is the 60th percentile.
-
- If the interpolation is “lower”, among 92 and 93, 92 is less than 93. So, 92 is the 60th percentile.
- If the interpolation is “higher”, among 92 and 93, 93 is greater than 92. So, 93 is the 60th percentile.
- If the interpolation is “midpoint”, the sum of 92 and 93 is divided by 2 => 185/2 => 92.5. This is the 60th percentile.
- If the interpolation is “nearest”, 92 is the 60th percentile.
Example 1: No Parameter
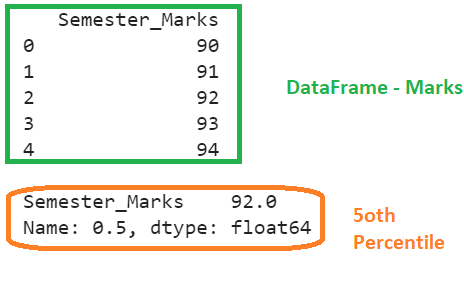
In this example, we won’t pass any parameter to the pandas.DataFrame.quantile() function. By default, it returns the 50th percentile (q=0.5) and the linear interpolation is considered. Create a DataFrame named “Marks” with one column and five records.
# Create DataFrame with 1 column and 5 records
Marks = pandas.DataFrame({'Semester_Marks':[90,91,92,93,94]})
print(Marks,"\n")
# quantile() with no parameters
print(Marks.quantile())
Output:
Explanation:
q=0.5 and interpolation is ‘linear’.
=> 0.5 * (5+1)
=> 3.
The fractional part is 0. Directly, it returns the third element which is 92. So, the 50th percentile is 92 for this DataFrame.
Example 2: Specifying the Quantile
Compute the 70th percentile. “Q” which is set to 0.7 is passed as a parameter. This DataFrame holds 10 values under the “Semester_Marks” column.
Marks = pandas.DataFrame({'Semester_Marks':[80,81,82,83,84,85,86,87,88,89]})
# Compute the 70th percentile
print(Marks.quantile(q=0.7))
Output:

Explanation:
q=0.7 and interpolation is ‘linear’ by default. The number of values is 10.
=> 0.7 * (10+1)
=> 7.7
The fractional part is 0.7. The value lies in the seventh and eight element. Here, 86 is the first element (i) and 87 is the second element (j).
=> [(86*0.7) + (87*0.3)]
=> [60.2 + 26.1] => 86.3
So, the 70th percentile is 86.3 for this DataFrame.
Example 3: Specifying the Interpolation Parameter
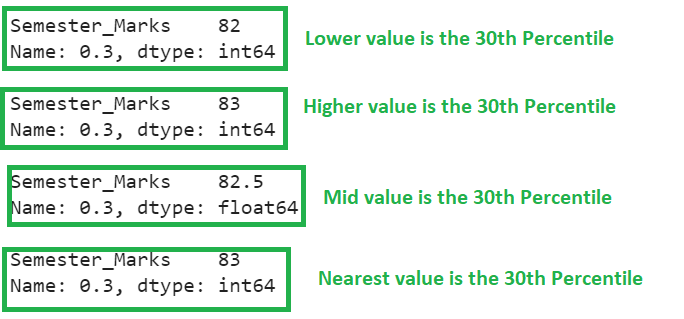
Use the DataFrame from Example 2 and compute the 30th percentiles by passing the “interpolation” parameter.
Marks = pandas.DataFrame({'Semester_Marks':[80,81,82,83,84,85,86,87,88,89]})
# Compute the 30th percentile by passing the interpolation parameter
print(Marks.quantile(q=0.3,interpolation='lower'),"\n")
print(Marks.quantile(q=0.3,interpolation='higher'),"\n")
print(Marks.quantile(q=0.3,interpolation='midpoint'),"\n")
print(Marks.quantile(q=0.3,interpolation='nearest'),"\n")
Output:
Explanation:
q=0.3 => 0.3 * (10+1) => 3.3. The values lie between the 3rd and 4th element. So i = 82 and j = 83.
- Here, “i” is less than “j”. So, the 30th percentile with the “lower” interpolation is 82.
- Here, “j” is greater than “j”. So, the 30th percentile with the “higher” interpolation is 83.
- Here, (i+j)/2 => (82+83)/2 => 82.5. So, the 30th percentile with the “midpoint” interpolation is 82.5.
- The nearest value is 83. So, the 30th percentile with the “nearest” interpolation is 82.5.
Example 4: Specifying the Axis Parameter
Let’s compute the percentiles across the rows and columns separately.
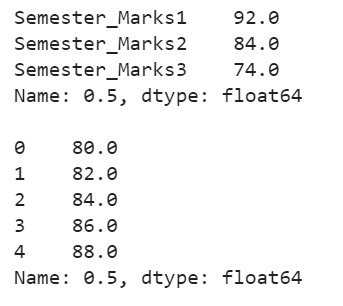
Marks = pandas.DataFrame({'Semester_Marks1':[90,91,92,93,94],'Semester_Marks2':[80,82,84,86,88],'Semester_Marks3':[70,72,74,76,78]})
# axis parameter set to 0
print(Marks.quantile(q=0.5,axis=0),"\n")
# axis parameter set to 1
print(Marks.quantile(q=0.5,axis=1),"\n")
Output:
Explanation:
q=0.5 => 0.5 * (5+1) => 3. The fractional part is 0.
- Directly, it returns the third element from each column [“Semester_Marks1” = 92, “Semester_Marks2” = 84, “Semester_Marks3” = 74].
- Directly, it returns the third element from each row [80, 82, 84, 86, 88].
Example 5: Compute Multiple Percentiles
Let’s compute the 80th, 40th, 50th, and 20th percentiles at a time with “midpoint” as the interpolation. Set “q” to [0.8, 0.4, 0.5, 0.2].
Marks = pandas.DataFrame({'Semester_Marks':[67,87,45,78,45,89,91,94,86,100]})
# Compute the 80th, 40th, 50th and 20th percentiles at a time with midpoint as interpolation
print(Marks.quantile(q=[0.8,0.4,0.5,0.2],interpolation='midpoint'))
Output:
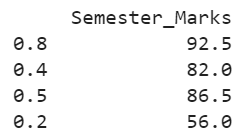
The 80th percentile is 92.5. The 40th percentile is 82. The 50th percentile is 86.5. And the 20th percentile is 56.
Conclusion
Now, you will be able to calculate the percentiles for the given DataFrame using the pandas.DataFrame.quantile() function. All the parameters are explained in this guide with examples. Before discussing the examples, the internal working of this function is discussed clearly to understand this concept better.